INDEPENDENT WORK / ICEPAK / REPORT REVISION 1
Explore the PCB
thermal results
By Mohammadreza Khani, PhD · Khani Solutions · Independent illustrative model; not manufacturer or employer hardware or results.
Native temperature maps and saved component values from the corrected smartphone assembly at 5.5 W heat input and 25 °C ambient.
Mesh and steady solve completed · energy residual meets its targetProvisional numerical results. Initialization diagnostics, global heat balance, mesh independence and physical validation remain open.
SAVED NATIVE FIELDS
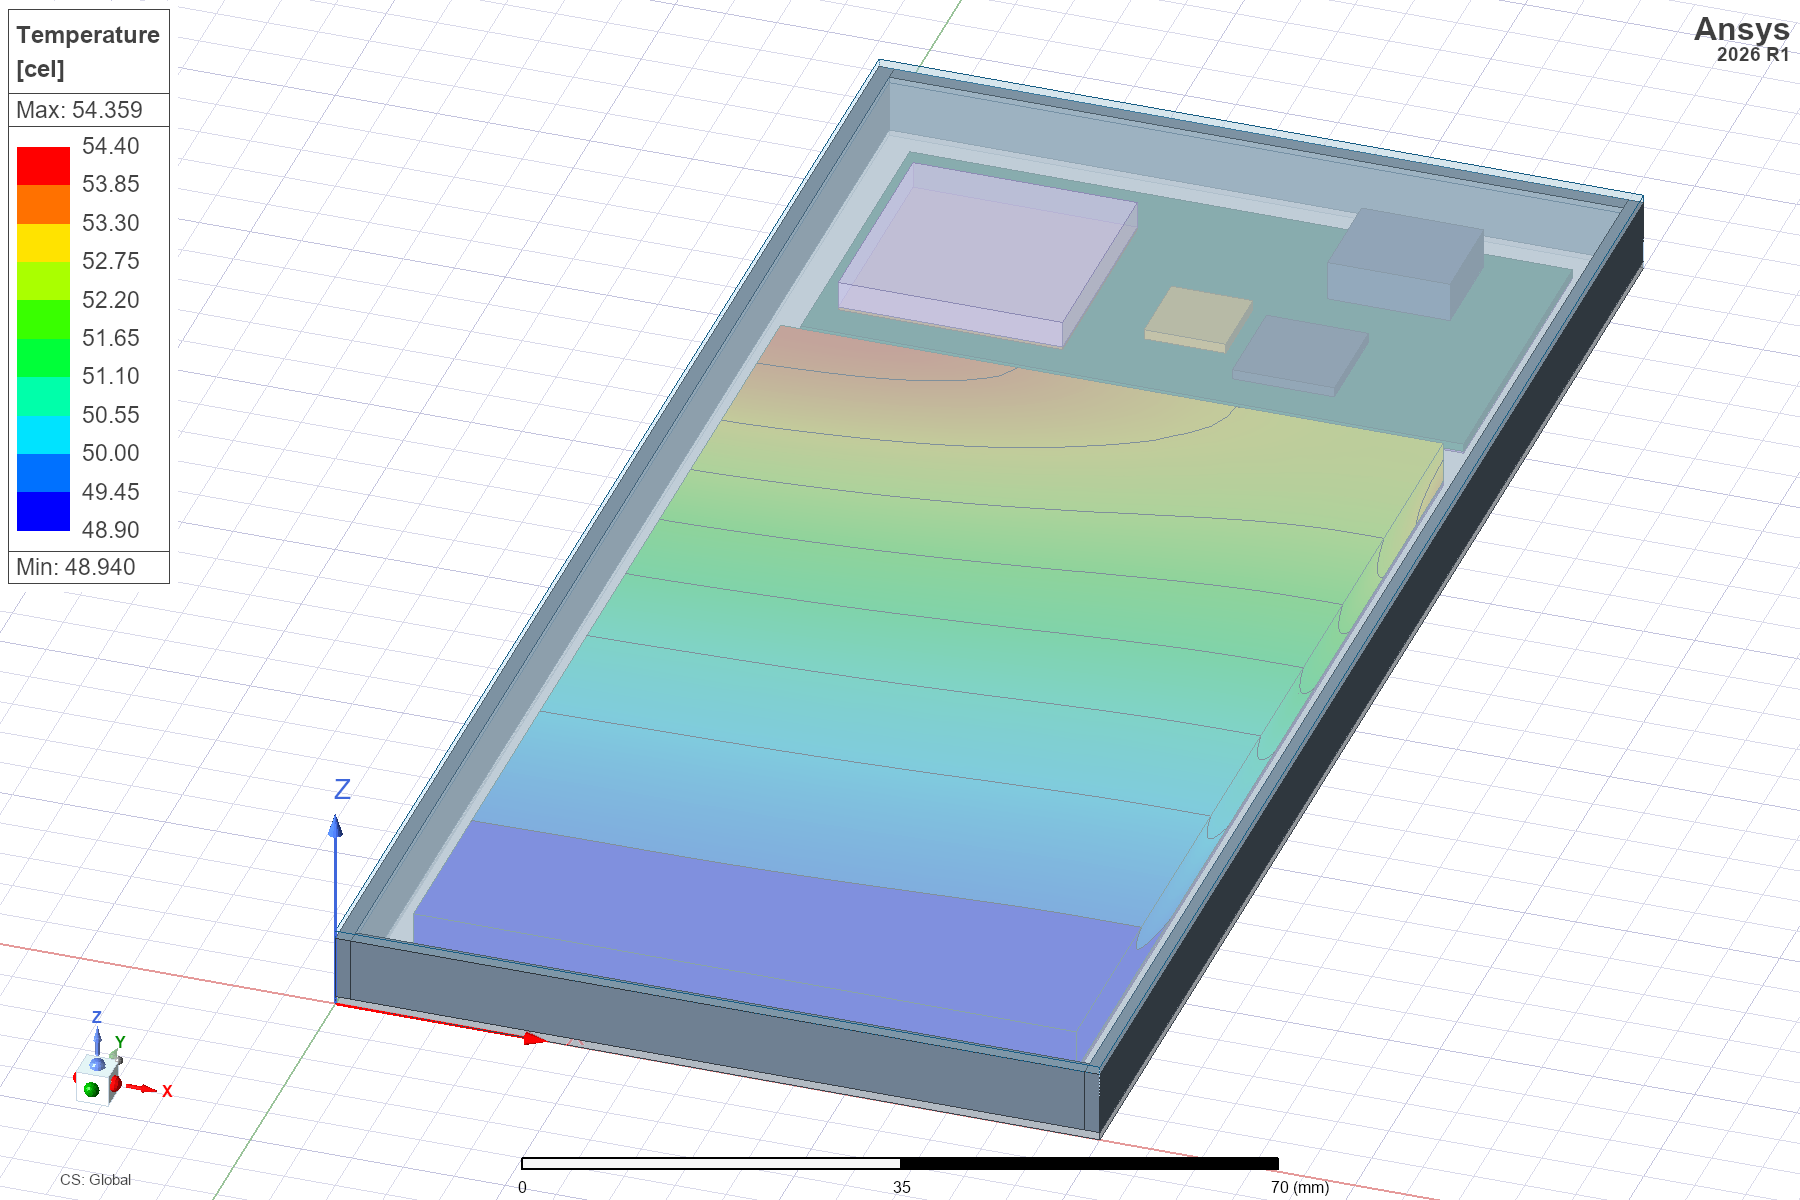
Inspect the heat distribution
100%
Battery surface display: maximum 54.359 °C. Saved battery volume maximum: 54.329 °C. These are different postprocessing statistics.
Drag to pan · wheel or + / − to zoom. These are original saved contour images, not a new solver run. No transient heating timeline is available from this steady result.
Full saved temperature table
| Component | Volume maximum °C | Vertex-average monitor °C |
|---|---|---|
| Battery Cell | 54.33 | 50.67 |
| Processor Package | 74.51 | 74.39 |
| PMIC Package | 67.29 | 66.74 |
| Display Layer | 72.60 | 50.32 |
| Memory Package | 61.06 | 60.39 |
| Camera Module | 61.13 | 60.54 |
| Main PCB | Not recorded | 59.25 |
| Rear Cover | Not recorded | 51.43 |
| Display Glass | Not recorded | 50.16 |
TRACE THE REPAIR
What changed from the failed run?
| Evidence | Earlier failed run | Corrected run |
|---|---|---|
| Cooling assignment | Region faces without usable cooling mesh | 18 physical exterior faces · 0.02776 m² |
| Mesh cells | 25,876 | 671,368 |
| Thin-part mapping | Missing TIM/copper mesh warnings | All 19 physical part names appear in mapping |
| Temperature limiter | Repeated 5,000 K cap | No limiter messages in corrected transcript |
| Energy residual | 1.4195 × 10⁻⁷ · target not met | 6.8952 × 10⁻⁹ · target met |
This compares a failed setup with a repaired setup. The old 4,726.85 °C value was a numerical cap, so it cannot be used to calculate a cooling-performance improvement. The two meshes do not establish a mesh-independence study.
Recorded energy residuals
One saved outer iteration; the configured 1,000 iterations is a ceiling. No extended convergence curve is inferred.
Completed, with checks still open
- Normal Completion; 63 seconds; 4 solver cores.
- The transcript contains
wta(1st) to string_lengthduring initialization. Its effect remains unresolved. - Independent outward heat balance against 5.5 W is not yet verified.
- Layer quality, mesh refinement and physical measurements remain to be checked.
The failed-run residuals are retained in the selector above. Original corrected-run diagnostics are included in the report downloads.
INSPECT THE ASSUMPTIONS
The model behind the results
75 × 160 × 8 mm illustrative phone. Steady conduction in solids and internal air; airflow, buoyancy and radiation are disabled. External h = 7 W/(m²·K), ambient 25 °C. Ideal contacts and effective materials are assumed. This is a separate model from the open-source PCB stages, not a matched solver benchmark.
Battery Cell · 65 × 108 × 4.2 mm · 0.8 W prescribed heat.
Prescribed thermal losses
5.5 W thermal generation in total. These are prescribed losses, not electrical charging power or an electrochemical battery model.
SEPARATE CALCULATION / NOT ICEPAK OUTPUT
Explore the analytical cooling screen
An ideal isothermal skin obeys T = Tambient + Q / (h A), with A = 0.02776 m². Adjusting these controls changes only this estimate; it does not recalculate the saved temperature maps or component results.
| Report analytical case | Heat W | h W/(m²·K) | Estimate °C |
|---|---|---|---|
| Weaker cooling | 5.500 | 3.5 | 81.61 |
| Nominal assumption | 5.500 | 7.0 | 53.30 |
| Stronger cooling | 5.500 | 14.0 | 39.15 |
| Higher heat input | 6.875 | 7.0 | 60.38 |
15-PAGE CORRECTED REPORT / ORIGINAL FILES
Read the report and inspect the evidence
Open corrected report PDFReport, plots & source · 4 MBFull native project & results · 78 MBAEDT model inputComponent maxima CSVVertex-average monitors CSVExplorer data & provenanceInteractive page source
Original PDF SHA-256: b33467dd8e3029652bbc7ef82a85ccc2d0687eb3a29c4e533506a185f48748a4. Source values are from the saved native volume summary and vertex-average monitors. Surface-display legends can differ from volume maxima. Report and native solver archives are original saved evidence. The interactive-page source download contains this public page, its controls and a local preview guide.