 Khani Solutions
Independent open-source thermal study · Stage 03
Heat spreads through the product.
Connect the cell to the PCB, chip packages and enclosure. Watch an unpowered component warm up from its neighbors, then inspect each component’s temperature map.
Assumed geometry, materials, heat loads and contacts. This is a layered finite-volume thermal model with lumped chip packages, without experimental validation. It is an independent teaching study and predicts no Apple or Wisk product performance.
Explore the component maps ↓ · Follow the modeling steps ↓ · Download the model and results ↓
Inspect one component or the whole assembly
Start with Electronics only and select the battery. Its source is zero, yet it warms through the product. Then switch to Battery + electronics. All visible solved parts use the same temperature scale. In the exploded view, rotate the stack to reveal the board, midplate, display and back-cover fields together.
Loading solved temperatures, thermal mesh and CAD…
Drag to rotate · Scroll to zoom · Colors show stored thermal solutions
All solved component temperatures at the selected time
| Component | Mean (°C) | Maximum (°C) | Representation |
|---|
A chip’s single temperature represents its effective package. It is not a predicted semiconductor junction temperature. The spatial layers have one thermal unknown through thickness per planar control volume. CAD surface colors display that layer value; they do not resolve exterior skin or internal through-thickness gradients. The mean is capacity weighted within each component.
Compare all 14 component maps at once
Build the coupled model, step by step
1 · Keep the battery experiment, add explicit electronics loads
The battery retains the Stage 02 spatial example’s 2 W total: 80% in the assumed 12 × 18 mm patch and 20% distributed throughout the cell. All parts start at 25 °C. Sources run for 600 seconds, then turn off until 1,800 seconds. Prescribed heat generation is distinct from electrical input power.
The new electronics load is 1.75 W total, distributed as below. These are 25% of the original CAD’s illustrative package powers, chosen as a moderate teaching case; neither set is measured product data.
| Package | Function equivalent | Heat (W) | Board |
|---|---|---|---|
| U01 | SoC + RAM | 1.000 | Main PCB |
| U02 | Power management | 0.175 | Main PCB |
| U03 | Storage | 0.075 | Main PCB |
| U04 | Wi-Fi / Bluetooth | 0.075 | Main PCB |
| U05 | Auxiliary IC | 0.050 | Main PCB |
| U06 | Modem | 0.250 | RF PCB |
| U07 | RF amplifier | 0.125 | RF PCB |
2 · Turn the CAD into thermal regions
Seven planar grids represent the cell, L-shaped main PCB, RF PCB, aluminum-equivalent midplate, perimeter frame, display equivalent and back glass. The main-board mounting holes and rounded enclosure outline are retained. Seven packages attach at their CAD footprints and use one temperature each. The grid clips control volumes at part boundaries instead of filling empty board space.
| Region | ρ (kg/m³) | cp (J/kg·K) | kxy (W/m·K) | kz (W/m·K) |
|---|---|---|---|---|
| Cell equivalent | 2,400 | 1,000 | 20 | 0.8 |
| Main / RF PCB | 1,900 | 900 | 12 | 0.5 |
| Midplate / frame | 2,700 | 900 | 160 | 160 |
| Display equivalent | 2,500 | 800 | 1 | 0.5 |
| Back glass | 2,500 | 800 | 1 | 1 |
| Chip packages | 2,000 | 800 | 3 | 3 |
Every property in this table is assumed. The PCB is a homogenized laminate: lateral copper spreading is represented by an effective conductivity. Individual traces, vias, solder balls and internal cell layers are not resolved.
3 · Add heat paths between parts
Q̇i→j = Gij (Ti − Tj) · Gcontact = A / R″total
A contact loses exactly as much heat from one node as it adds to the other. The resistance includes the participating half-layer thicknesses, interface material and an assumed area-specific contact resistance of 0.0002 m²·K/W for the solid contacts.
| Path | Representation |
|---|---|
| Cell → midplate | 0.15 mm adhesive, k = 0.5 W/(m·K), over the cell footprint |
| Packages → boards | Distributed contact over each package footprint; package and board half-thickness resistances |
| Main PCB → midplate | 14 × 14 mm pedestal / TIM path, four annular supports, and the remaining 1.2 mm air gap |
| RF PCB → main PCB | Four 0.35 mm-radius equivalent posts plus the remaining 0.6 mm gap |
| Midplate → display → surroundings | Distributed laminate contact; exterior display face exchanges heat with ambient |
| Panels → frame | Perimeter contacts; lateral spreading in each panel and the frame |
| Internal surfaces → back glass | Effective gap conduction and linearized radiation; each projected area is assigned once to the uppermost modeled surface |
Internal air uses k = 0.026 W/(m·K), plus a fixed 4 W/(m²·K) radiative conductance between facing parts. Gap heights follow the simplified CAD: cell 0.8 mm, RF board 2.2 mm, main board 3.4 mm and exposed midplate 5.4 mm to the back cover; package tops use their remaining clearance. This is a prescribed gap model, without a fluid-flow calculation.
4 · Cool the outside of the product
Only the display’s exterior face, back cover’s exterior face and exposed frame exchange heat with the 25 °C room, using the assumed combined effective coefficient of 8 W/(m²·K). The buried battery and boards have no direct ambient sink. Internal radiation transfers heat between parts and is separate from this exterior loss term.
This changes the thermal paths, storage and boundary conditions from Stage 02. Comparing their absolute temperatures is therefore a model-development comparison, not a one-variable cooling experiment. The original Stage 01 and Stage 02 results remain available.
5 · Separate the sources to explain the result
| Case | Battery source | Electronics source | Cell mean at 10 min |
|---|---|---|---|
| Battery only | 2 W | 0 W | 35.38 °C |
| Electronics only | 0 W | 1.75 W | 30.67 °C |
| Both | 2 W | 1.75 W | 41.04 °C |
The unpowered cell reaches 30.67 °C because the electronics warm the boards, midplate and back cover; those parts transfer heat into the cell. In the combined case, the cell’s own heating and the warmer surroundings both raise its temperature. With constant properties, the rises above ambient add: (35.38 − 25) + (30.67 − 25) ≈ 41.04 − 25 K, allowing for rounded numbers.
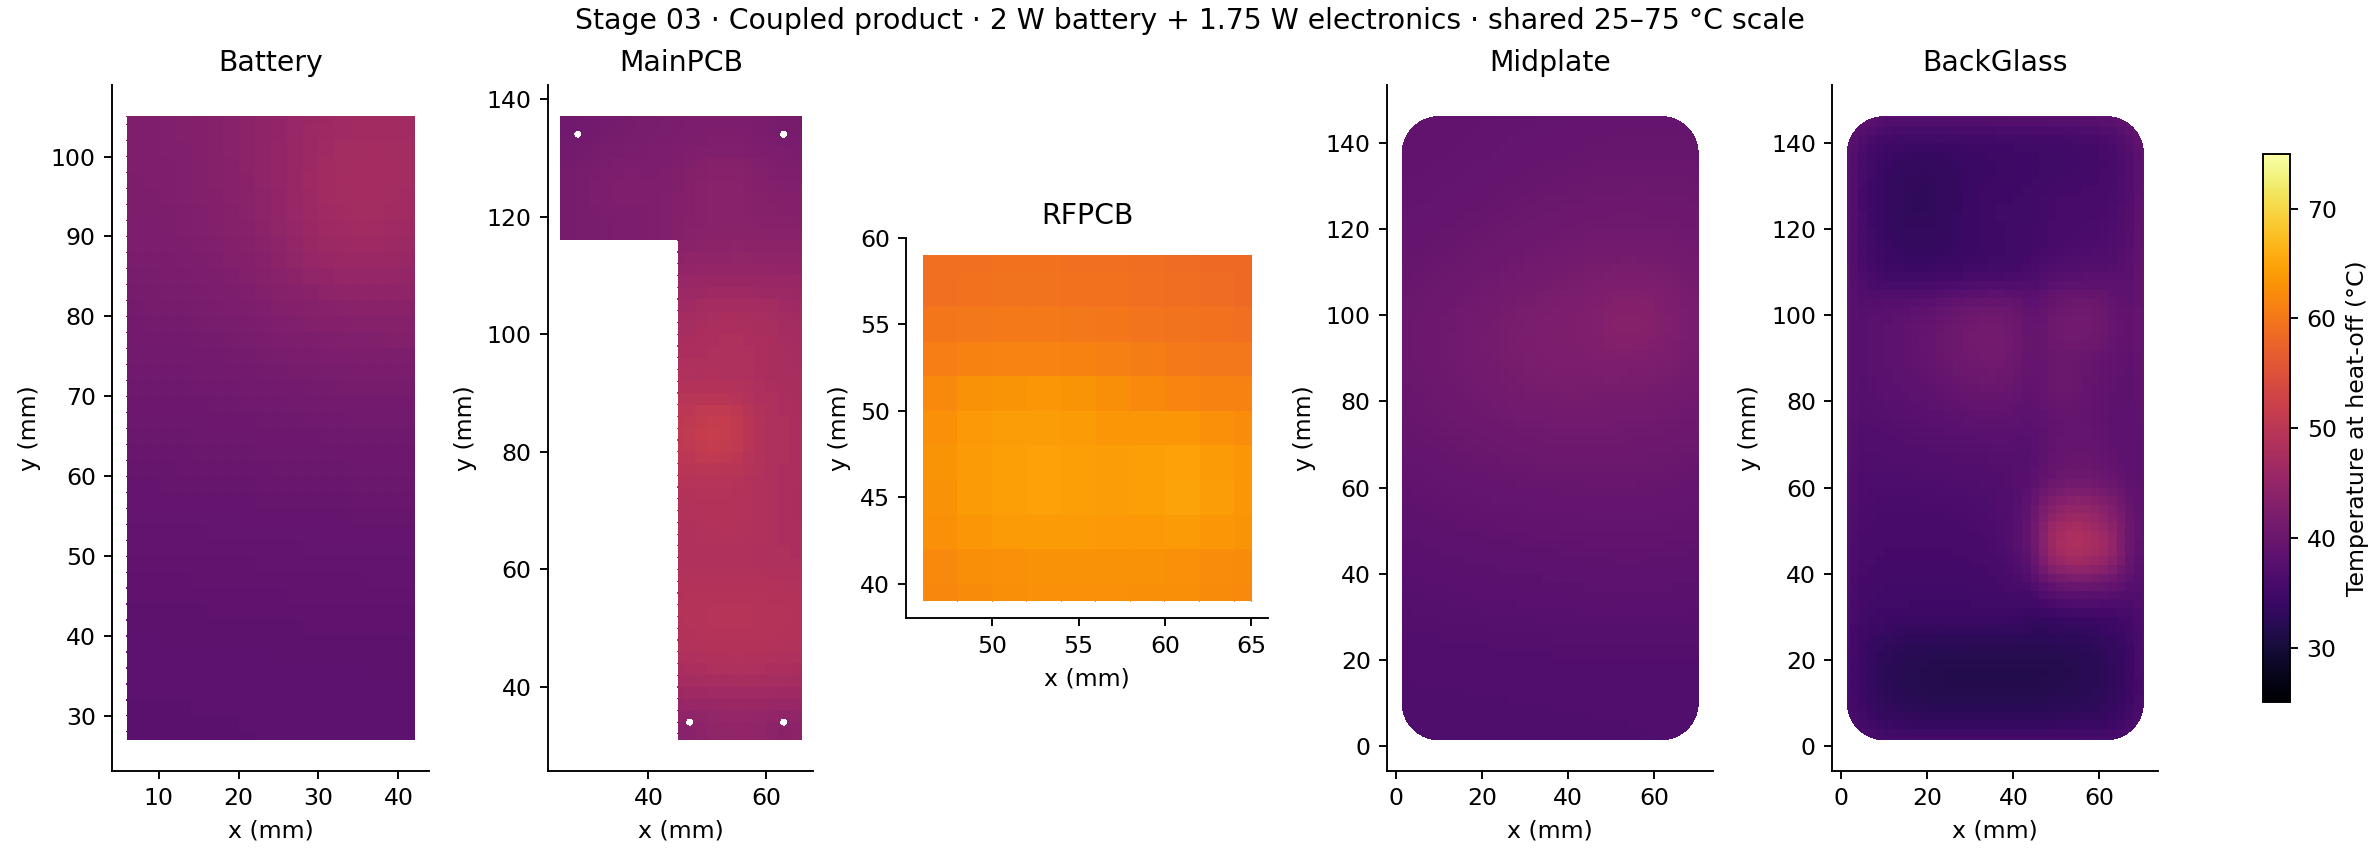
The RF board reaches a 64.70 °C local maximum, while the main PCB reaches 51.41 °C. The small RF board has concentrated sources and restricted paths to the enclosure. U07 reaches a 68.52 °C effective package temperature despite generating only 0.125 W. Temperature depends on neighboring sources and thermal resistance as well as a component’s own power. These values identify a bottleneck in this assumed network, not a device temperature limit or a qualified design.
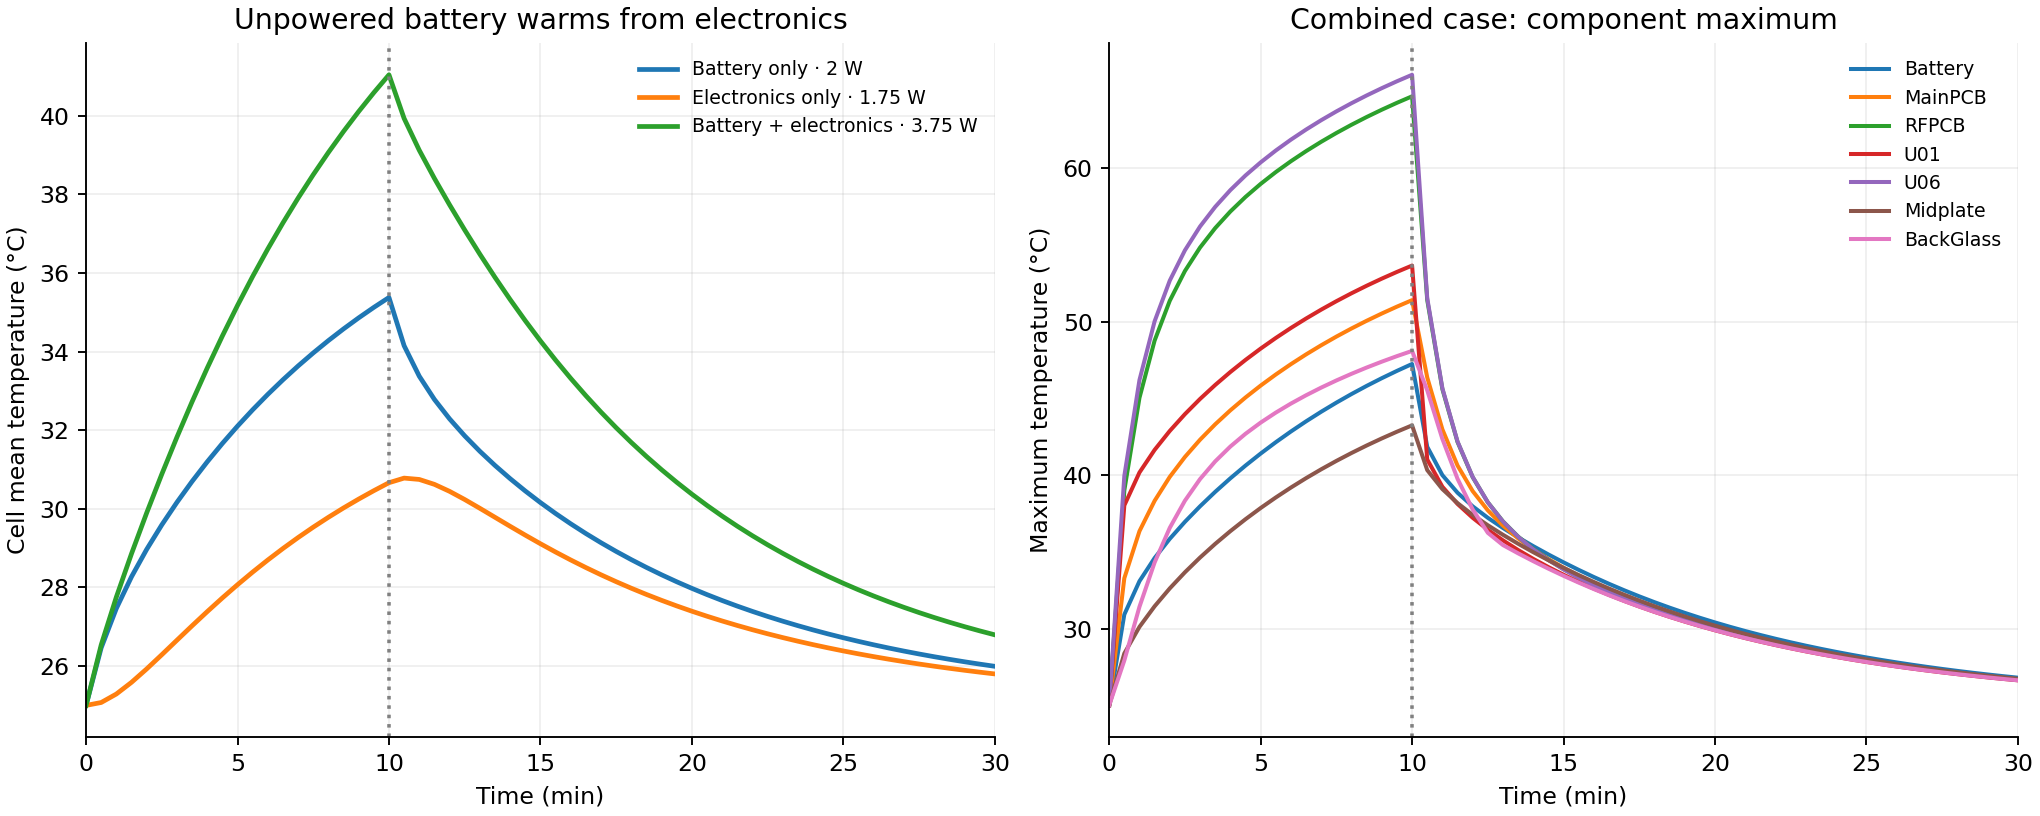
After heat-off, some unpowered regions can keep warming briefly while hotter neighbors cool. Total product energy still decreases. A single time constant no longer describes the coupled system.
Static component maps at 10 minutes
6 · Verify the equations before interpreting the maps
Ci dTi/dt = Q̇i − Σ Gij(Ti − Tj) − Gambient,i(Ti − 25 °C)
Conservative finite volumes handle lateral conduction. A symmetric conductance network joins layers and packages. Backward Euler advances the transient with a 2 s time step; SciPy factors the sparse matrix once and reuses it for all three sources. The browser displays saved results every 30 s; it does not run a new thermal solve.
- Energy balance: supplied heat equals stored heat plus exterior losses to within 1.1 × 10⁻⁹ J over the run.
- Source separation: combined temperature rise matches the sum of the two isolated-source rises to within 1.3 × 10⁻¹³ K before float32 browser export.
- Spatial refinement: 9,683 versus 37,156 total nodes; largest change in a component’s maximum at 600 s is 0.308 K, at U07.
- Time refinement: reducing 2 s to 1 s changes component maxima at 600 s by at most 0.0081 K.
- Independent benchmark: a two-node network is compared with its exact matrix-exponential solution; error is below 0.000034 K with a 0.001 s step.
These checks support numerical consistency. They do not validate the assumed materials, gap model or contacts. Measurements of package/cell temperatures, thermal capacities, interface resistance and external conditions are still needed before product predictions. Stage 04 now tests an RF-to-enclosure thermal pad with matched before/after maps and fixed heat loads.
Included, collapsed and omitted geometry
Four enclosure solids, two boards, the cell and seven chip packages have temperatures. Adhesive, mounts, pedestal, TIM and RF posts are massless conductance links without independent temperatures. BMS parts, connectors, passives, camera, speaker and haptic are omitted from the thermal network. The optional upper SoC TIM / graphite / copper bridge is not active in this stage. Gray context may therefore include a collapsed link or omitted part.
The frame is a planar ring with its depth included in heat capacity and lateral conductance; its small USB cutout is omitted from the thermal mesh. The full CAD retains the opening. Accessory volumes do not displace the assumed cavity transfer paths. No through-thickness cell gradient, natural-convection flow, electrochemistry, temperature-dependent properties, deformation, safety assessment or thermal-runaway behavior is solved.
Reproduce the model and inspect its mesh
Use free Python, NumPy, SciPy, Shapely and Matplotlib to rerun the model. FreeCAD opens the geometry; ParaView opens each case’s transient.pvd. The source archive contains the exact input JSON, solver, thermal mesh, source vectors, conductance links, histories and saved fields.
Solver reference: SciPy sparse factorization. The custom thermal solver uses the published assumptions; CAD is an independent surrogate.