 Khani Solutions
Independent open-source thermal study · Stage 04
Cool the RF board with a thermal pad.
Keep the heat sources fixed. Replace a small RF-board air gap with a pad to the back cover, then follow the heat as the board cools and the enclosure warms.
All geometry, properties, contacts and loads are teaching assumptions. This layered thermal model has numerical verification but no experimental validation. These are independent concept results, without a claim of Apple or Wisk product performance or temperature-limit compliance.
Explore before / after maps ↓ · Follow the explanation ↓ · Download CAD, source and results ↓
Compare the same component at the same time
Switch between Before · air gap and After · RF thermal pad. The camera, time and color scale stay fixed. Select the RF board, RF packages or back cover to trace the effect. Open the paired map gallery below to see both configurations together.
Loading baseline and thermal-pad results…
Drag to rotate · Scroll to zoom · Saved finite-volume temperature fields
Paired before / after maps for every solved component
All component temperatures at the selected time
| Component | Before max (°C) | After max (°C) | Change in max (K) | Mean before → after (°C) |
|---|
Negative change means cooling. Maxima can occur at different locations. Mean values are capacity weighted within each component. A package has one effective temperature, not a semiconductor junction prediction. Layer values are displayed on CAD surfaces but do not resolve through-thickness or exterior skin gradients.
Why the temperatures change, step by step
1 · Reproduce the before case
The before case is exactly the Stage 03 combined configuration: 2 W in the cell and 1.75 W across seven packages. All nodes start at 25 °C, heat runs for 600 s, and sources then turn off until 1,800 s. Exterior display, back-cover and frame surfaces retain the same 8 W/(m²·K) effective ambient loss coefficient.
The code checks the full baseline history against the frozen Stage 03 field. Every saved float32 baseline temperature matches byte for byte. Original components keep the same capacities, sources, exterior sinks and unmodified contact links.
2 · Fit one pad into an existing clearance
The assumed pad is 16 × 5 × 2.2 mm installed, spanning x = 47–63 mm and y = 54–59 mm. It rests on an unpopulated RF-board strip and reaches the enclosure’s back glass. CAD checks confirm it clears U06 and U07, touches the RF board at z = 4.8 mm and the cover at z = 7.0 mm, and introduces no solid overlap.
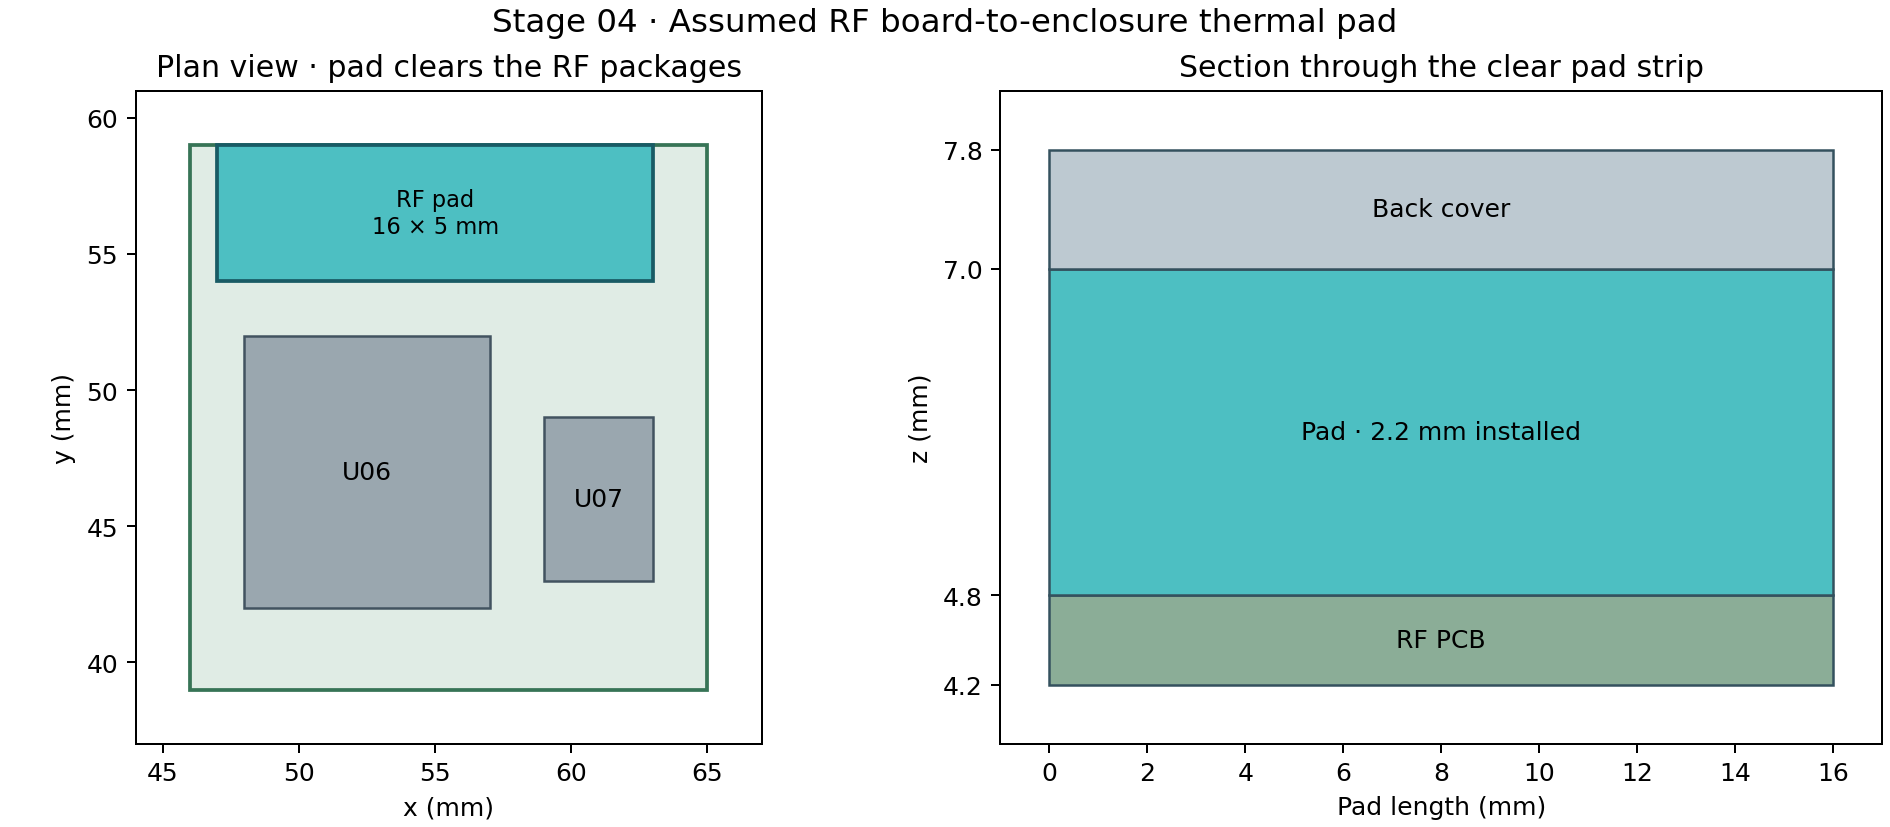
Pad conductivity is assumed to be 3 W/(m·K), density 2,200 kg/m³ and specific heat 1,000 J/(kg·K). Each of its two interfaces has an assumed area-specific resistance of 0.0002 m²·K/W. The pad adds 0.387 g and 0.387 J/K of thermal capacity. Its installed thickness is prescribed; pressure, compression and tolerance mechanics are not solved.
3 · Replace the air path with a lower resistance path
Rpad = L/(kA) · Rcontact = R″/A · Q̇ = ΔT/R
The 80 mm² pad footprint previously transferred heat through a 2.2 mm air gap with linearized internal radiation. The pad replaces that covered path; its heat-transfer conductance is not added in parallel with the same air-gap area.
| Series contribution | Resistance (K/W) |
|---|---|
| Pad bulk, 2.2 mm / 3 W/(m·K) | 9.17 |
| Two pad contacts combined | 5.00 |
| RF-board and back-cover half-thicknesses | 12.50 |
| Total board-node to cover-node path | 26.67 |
| Before: same footprint through air / radiation, including half-layers | 802.73 |
The new path has about 30.1 times the steady series conductance over that footprint. Contacts and the PCB/glass layers still restrict heat transfer, so conductivity alone does not determine the improvement. The pad has its own transient temperature and stores energy; the steady series equivalent does not imply identical heat flow through both contacts at every instant.
4 · Follow heat into the enclosure
At 600 s, the board transfers 0.0956 W into the pad, while 0.0903 W leaves the pad for the back cover. The small difference is the pad’s ongoing energy storage. The cover is part of the solved product, not a fixed 25 °C heat sink, so the area around the new contact warms.
Across the full RF board-to-back region, the before gap carries 0.0741 W. After installation, the uncovered gap carries 0.0384 W and the pad-to-cover path carries 0.0903 W. Other conductive paths also redistribute heat as temperatures change.
5 · Compare cooling and enclosure warming
| Measure at 600 s | Before (°C) | After (°C) | After − before (K) |
|---|---|---|---|
| RF board maximum | 64.70 | 61.25 | -3.45 |
| U06 package temperature | 66.10 | 62.42 | -3.69 |
| U07 package temperature | 68.52 | 65.04 | -3.47 |
| Main PCB maximum | 51.41 | 51.12 | -0.29 |
| Cell mean | 41.04 | 40.94 | -0.10 |
| Back-cover layer maximum | 48.10 | 52.10 | +3.99 |
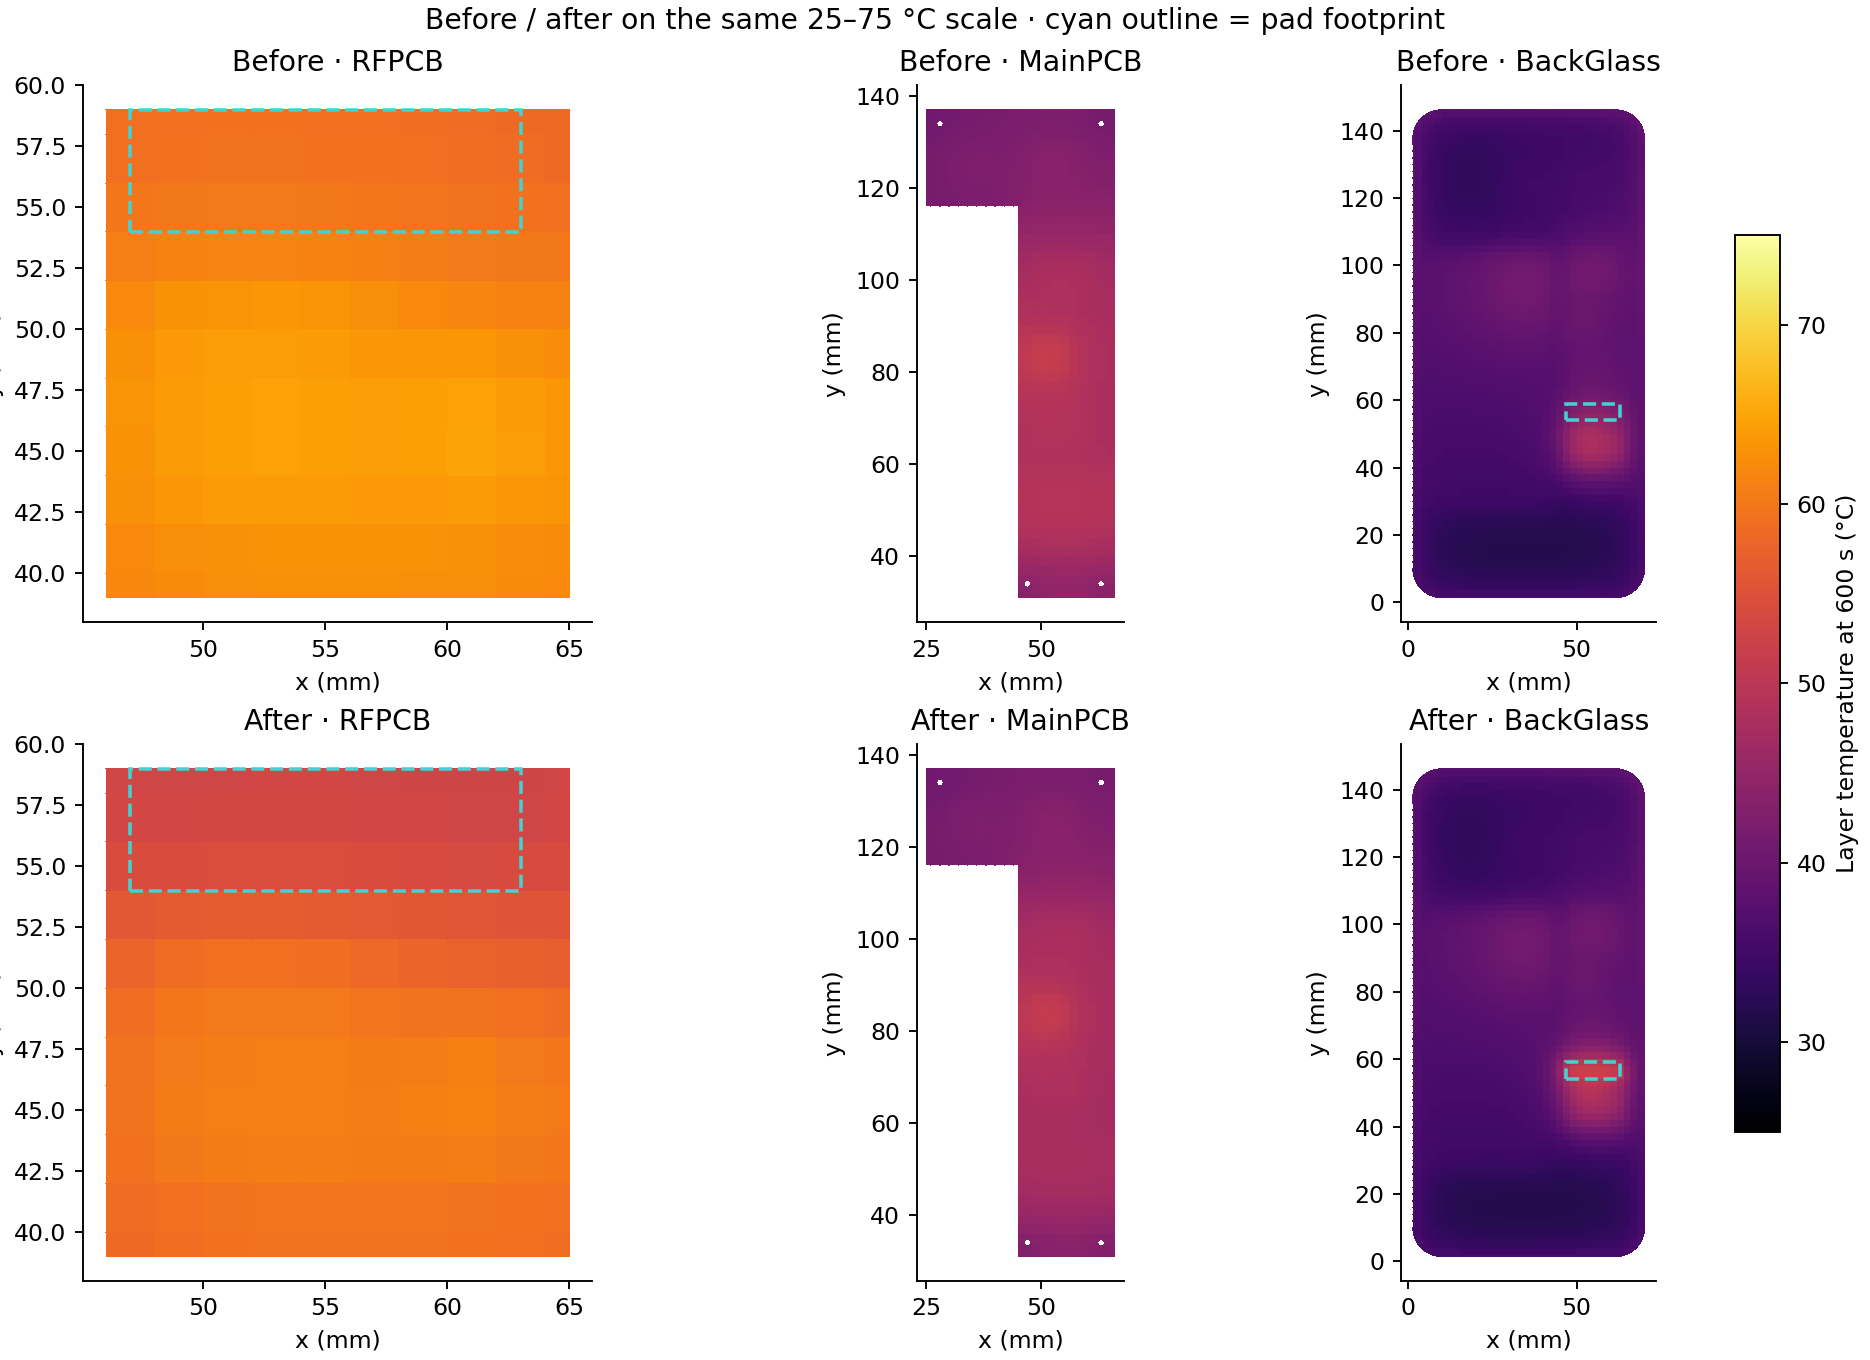
The RF board and its packages cool because more heat reaches the cover through the new path. The pad-contact region on the back-cover layer averages 43.03 → 51.10 °C, while the whole back cover’s maximum changes from 48.10 to 52.10 °C. The maximum can move to a different location; the maps show that movement.
The cell mean changes only slightly, from 41.04 to 40.94 °C. Its 2 W source is unchanged, and its main heat paths remain the cell adhesive, midplate and surrounding product. Improving one small RF path does not produce the same temperature change in every component.
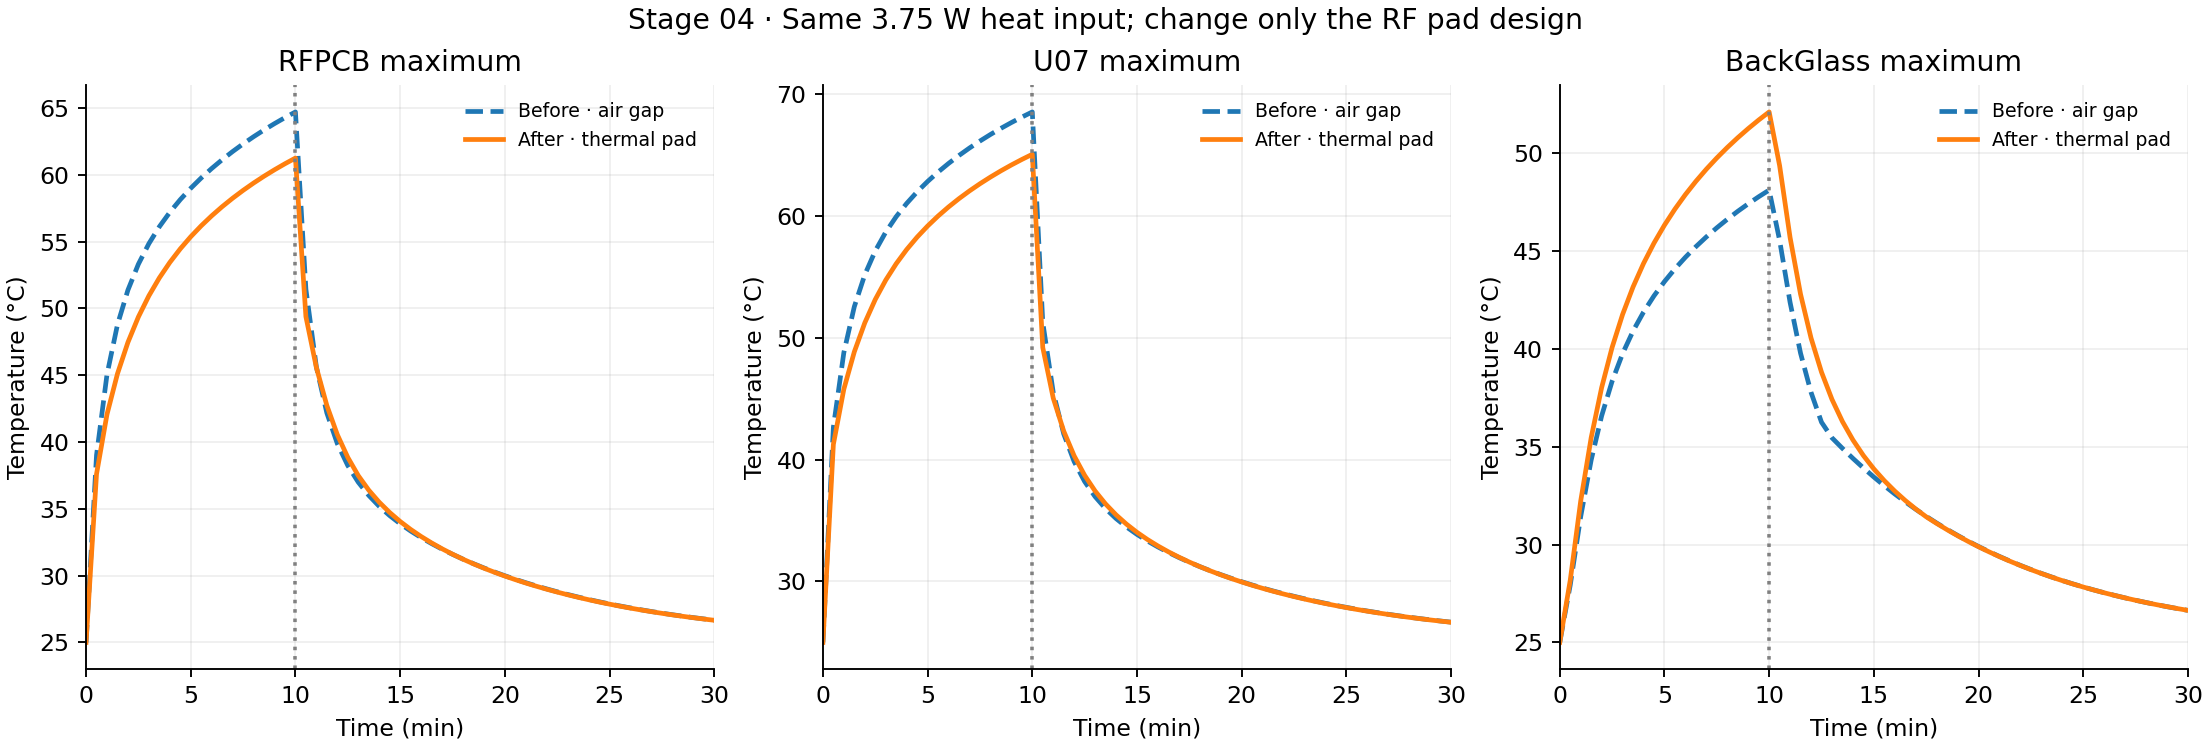
Both configurations receive exactly 2,250 J by heat-off. Exterior heat loss by 600 s is 836.02 J before and 835.87 J after; the difference is tiny. At this time the main effect is redistribution of temperature and stored heat, including the pad’s added capacity. A lower RF temperature alone does not establish a lower enclosure temperature or greater total heat rejection.
Matched static temperature maps at 10 minutes
6 · Check the model and state the limits
The after case has 9,710 thermal nodes: the same 9,683 baseline nodes plus 27 pad control volumes. The pad is a spatial layer with finite mass, lateral conduction, and separate resistances to the board and cover. Each contact removes exactly as much heat from one node as it adds to its neighbor.
- Baseline preservation: saved fields match Stage 03 byte for byte; unchanged sources, capacities, exterior sinks and links are checked directly.
- Energy conservation: maximum residual is below 1.1 × 10⁻⁹ J in both runs.
- Source superposition: independent battery/electronics source runs agree with their combined rise to within 1.6 × 10⁻¹³ K before browser export.
- Grid refinement: 9,710 versus 37,236 total nodes; largest component-maximum difference at 600 s is 0.4675 K.
- Time refinement: 2 s versus 1 s; largest component-maximum difference at 600 s is 0.00811 K.
On the finer grid, the RF-board maximum reduction is 3.33 K, compared with 3.45 K on the working grid; the cooling effect changes by 0.12 K. Refinement differences are numerical observations, not experimental uncertainty bounds. The baseline’s numerical checks remain available in Stage 03. One thermal unknown is used through the thickness of each planar control volume; internal package/junction gradients, natural-convection flow, nonlinear radiation, pad compression, reliability and touch-temperature limits are outside this stage. Pad side-face transfer to the internal cavity is omitted. Measured pad/contact and product thermal data are required before physical validation.
A useful next experiment is to vary pad conductivity, contact resistance, area or enclosure spreading one at a time, then judge both the RF temperature and the cover temperature against defined design requirements.
Inspect the CAD, thermal network and saved results
All solver and authoring tools are free and open source: FreeCAD, Python, NumPy, SciPy, Shapely, Matplotlib and ParaView. The source archive reproduces the before/after thermal solve without FreeCAD; FreeCAD is needed only to rebuild the CAD.
Sparse-solver reference: SciPy factorization. Component properties and pad values are assumptions, not vendor specifications.