 Khani Solutions
Independent open-source thermal study · Stage 05
Spread the heat beneath the back cover.
A bonded graphite sheet reduces the concentrated hot spot created by the RF cooling pad. Compare the lower peak with the larger warm area, while keeping heat generation and exterior cooling fixed.
All geometry, material, interface and load inputs are teaching assumptions. These are numerically verified layered thermal models, without experimental validation or product qualification. No Apple or Wisk product performance is claimed.
Inspect the temperature maps ↓ · Follow the explanation ↓ · Download the model and CAD ↓
Compare the cover maps and follow the heat
Switch between Pad only, Pad + graphite and the low lateral-k control. Time and color scale stay fixed. The paired gallery compares the pad-only and graphite designs together. The control has the same new stack as graphite, changing only its in-plane conductivity.
Loading three solved configurations…
Drag to rotate · Scroll to zoom · Saved finite-volume temperature fields
Paired pad-only / graphite maps for every component
All component temperatures at the selected time
| Component | Pad-only max (°C) | Graphite max (°C) | Change in max (K) | Mean pad-only → graphite (°C) |
|---|
Negative change means cooling. Maxima can occur at different locations. Mean values are capacity weighted within each component. A package has one effective temperature, not a semiconductor junction prediction. Layer values are displayed on CAD surfaces but do not resolve through-thickness or exterior skin gradients.
Why the temperatures change, step by step
1 · Preserve the thermal-pad reference
The pad-only case exactly reproduces Stage 04: 2 W in the cell, 1.75 W across seven packages, 25 °C initial and ambient temperature, sources on for 600 s and off until 1,800 s. The exterior display, back glass and frame retain the same 8 W/(m²·K) effective loss coefficient. The saved baseline field is checked byte for byte against Stage 04.
2 · Install a sheet inside the same enclosure
The assumed graphite sheet is 30 × 50 × 0.10 mm, over x = 38–68 mm and y = 30–80 mm. A 0.025 mm adhesive bonds it to the inner back glass. To fit both layers, the installed RF pad changes from 2.2 to 2.075 mm. The outer cover, frame and external cooling area stay fixed.
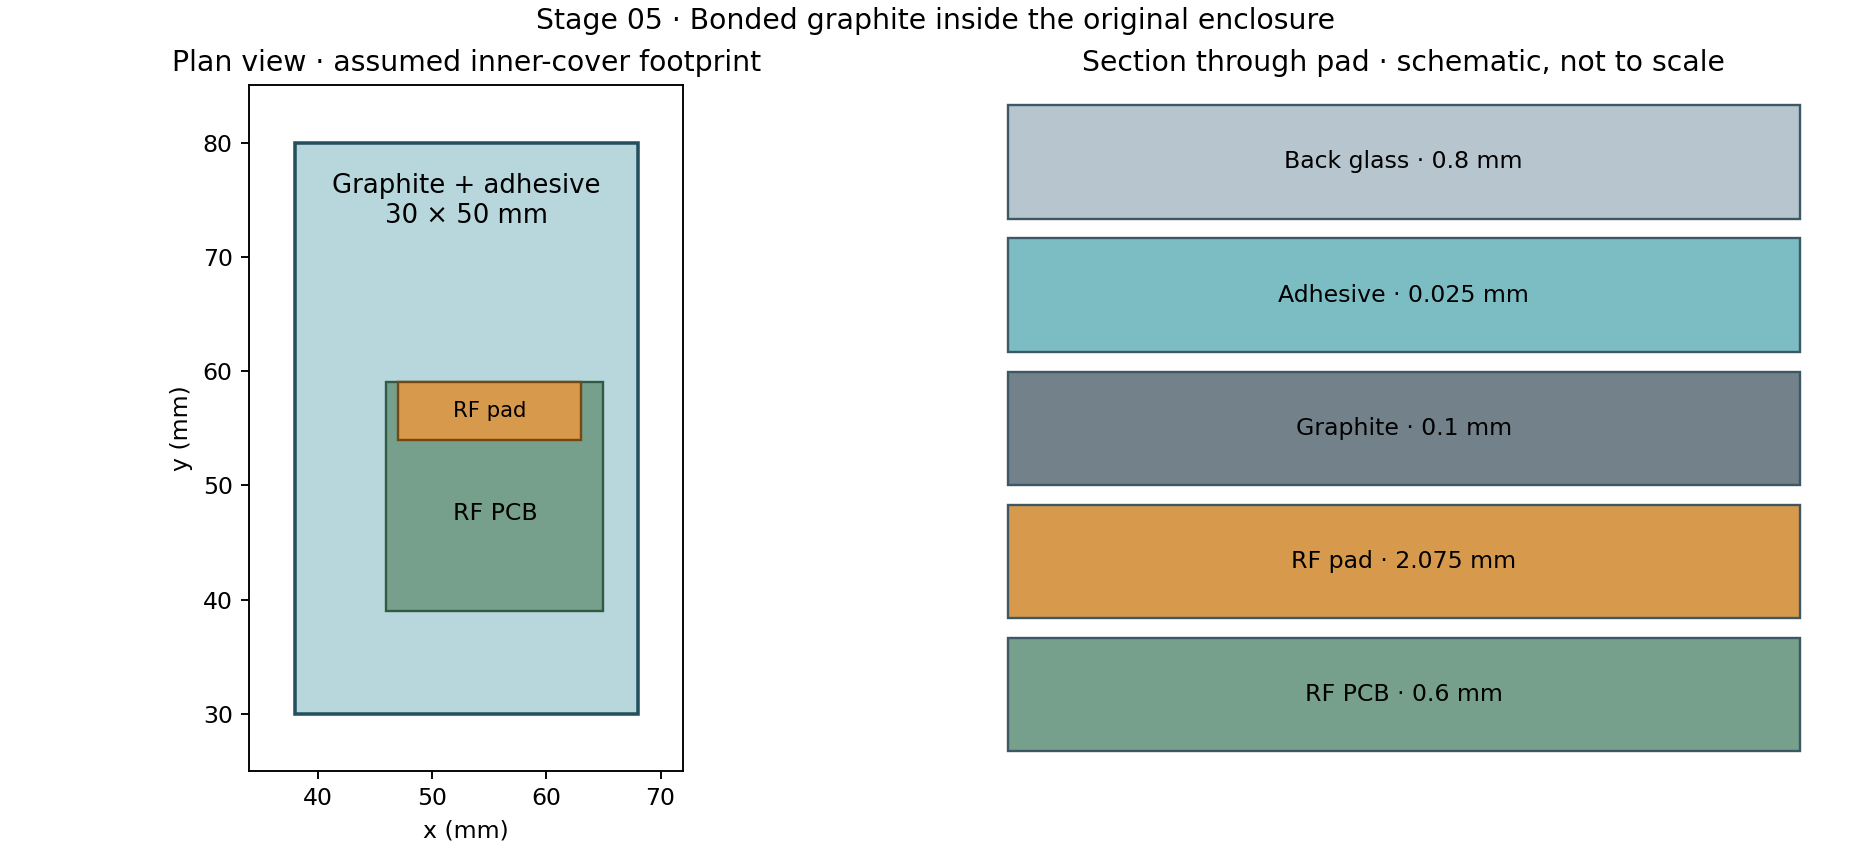
This is an assembly change that includes a thinner pad and added interfaces. It is therefore accompanied by a conductivity control to isolate lateral spreading. CAD checks find 67 valid solids without overlap, 80 mm² of pad-to-graphite contact and 1,500 mm² at each bonded-sheet interface.
3 · Model anisotropy and the real thermal paths
Gx = kx · t · Δy/Δx · Rz = L/(kzA) · Q̇ = ΔT/R
The graphite assumption is kx = ky = 800 W/(m·K) and kz = 5 W/(m·K). It conducts much more readily along the sheet than through its thickness. Its sheet conductance, kxyt = 0.08 W/K per square, is 100 times that of the modeled 0.8 mm glass layer, whose value is 0.0008 W/K per square.
Graphite density is assumed to be 1,800 kg/m³ and specific heat 700 J/(kg·K). The adhesive uses k = 0.2 W/(m·K), density 1,200 kg/m³ and specific heat 1,500 J/(kg·K), with 0.0001 m²·K/W at each bonded interface. The pad-to-graphite interface retains the pad’s 0.0002 m²·K/W contact assumption. Half-layer resistances are included.
Both new layers have their own temperature fields and finite heat capacity. Their masses are 0.270 g and 0.045 g. Removing 0.125 mm of pad offsets 0.022 g, so the net added mass is 0.293 g and net added capacity is 0.2345 J/K. Internal air/radiation paths terminate on graphite where it covers a surface; the corresponding old direct-to-glass paths are removed. There is no new sink to ambient.
For background, Panasonic documents high X–Y conductivity for PGS graphite sheets. The values above form an independent illustrative material set; they are not taken as the specifications of a selected Panasonic grade.
4 · Separate lateral spreading from the other stack changes
The diagnostic control keeps the new graphite/adhesive geometry, mass, contacts and through-thickness conductivity. It changes only the sheet’s in-plane conductivity from 800 to 5 W/(m·K). It represents a numerical control, not another commercial material.
| Measure at 600 s | Pad only (°C) | Graphite (°C) | Change (K) | Low lateral-k control (°C) |
|---|---|---|---|---|
| Back-cover layer maximum | 52.10 | 41.04 | -11.06 | 50.03 |
| Back-cover layer mean | 36.64 | 36.68 | +0.04 | 36.64 |
| RF-board maximum | 61.25 | 55.02 | -6.23 | 59.88 |
| RF amplifier package | 65.04 | 58.68 | -6.36 | 63.63 |
| Cell mean | 40.94 | 41.02 | +0.07 | 40.94 |
The low lateral-k control reaches a 50.03 °C cover maximum, versus 41.04 °C with high lateral conductivity. Because those two configurations share the same assembly and vertical properties, their difference demonstrates the role of lateral heat spreading in this model.
5 · Read the peak and the warm area together
With the pad alone, heat enters a small back-cover region and the glass spreads it weakly. Graphite carries heat outward before it crosses the adhesive into the cover. The cover maximum falls by 11.06 K, while its mean changes only from 36.64 to 36.68 °C.
| Back-cover diagnostic at 600 s | Pad only | Graphite | Low lateral-k control |
|---|---|---|---|
| Area above 40 °C (mm²) | 1012.0 | 1628.0 | 1056.0 |
| Area above 45 °C (mm²) | 300.0 | 0.0 | 256.0 |
| Maximum minus minimum (K) | 20.6 | 9.4 | 18.5 |
The cover maximum shifts from the control-volume center at (55, 55) mm over the pad to (35, 95) mm, outside the sheet and over the cell’s prescribed hot-source patch. The RF-pad region is no longer the location of the global cover maximum. The area above 40 °C grows even as the hot spot weakens. These thresholds are visualization diagnostics, not touch-temperature or safety limits. Areas are calculated from finite-volume cell-center values, with entire control-volume areas counted at each threshold; they are not interpolated contour-boundary measurements.
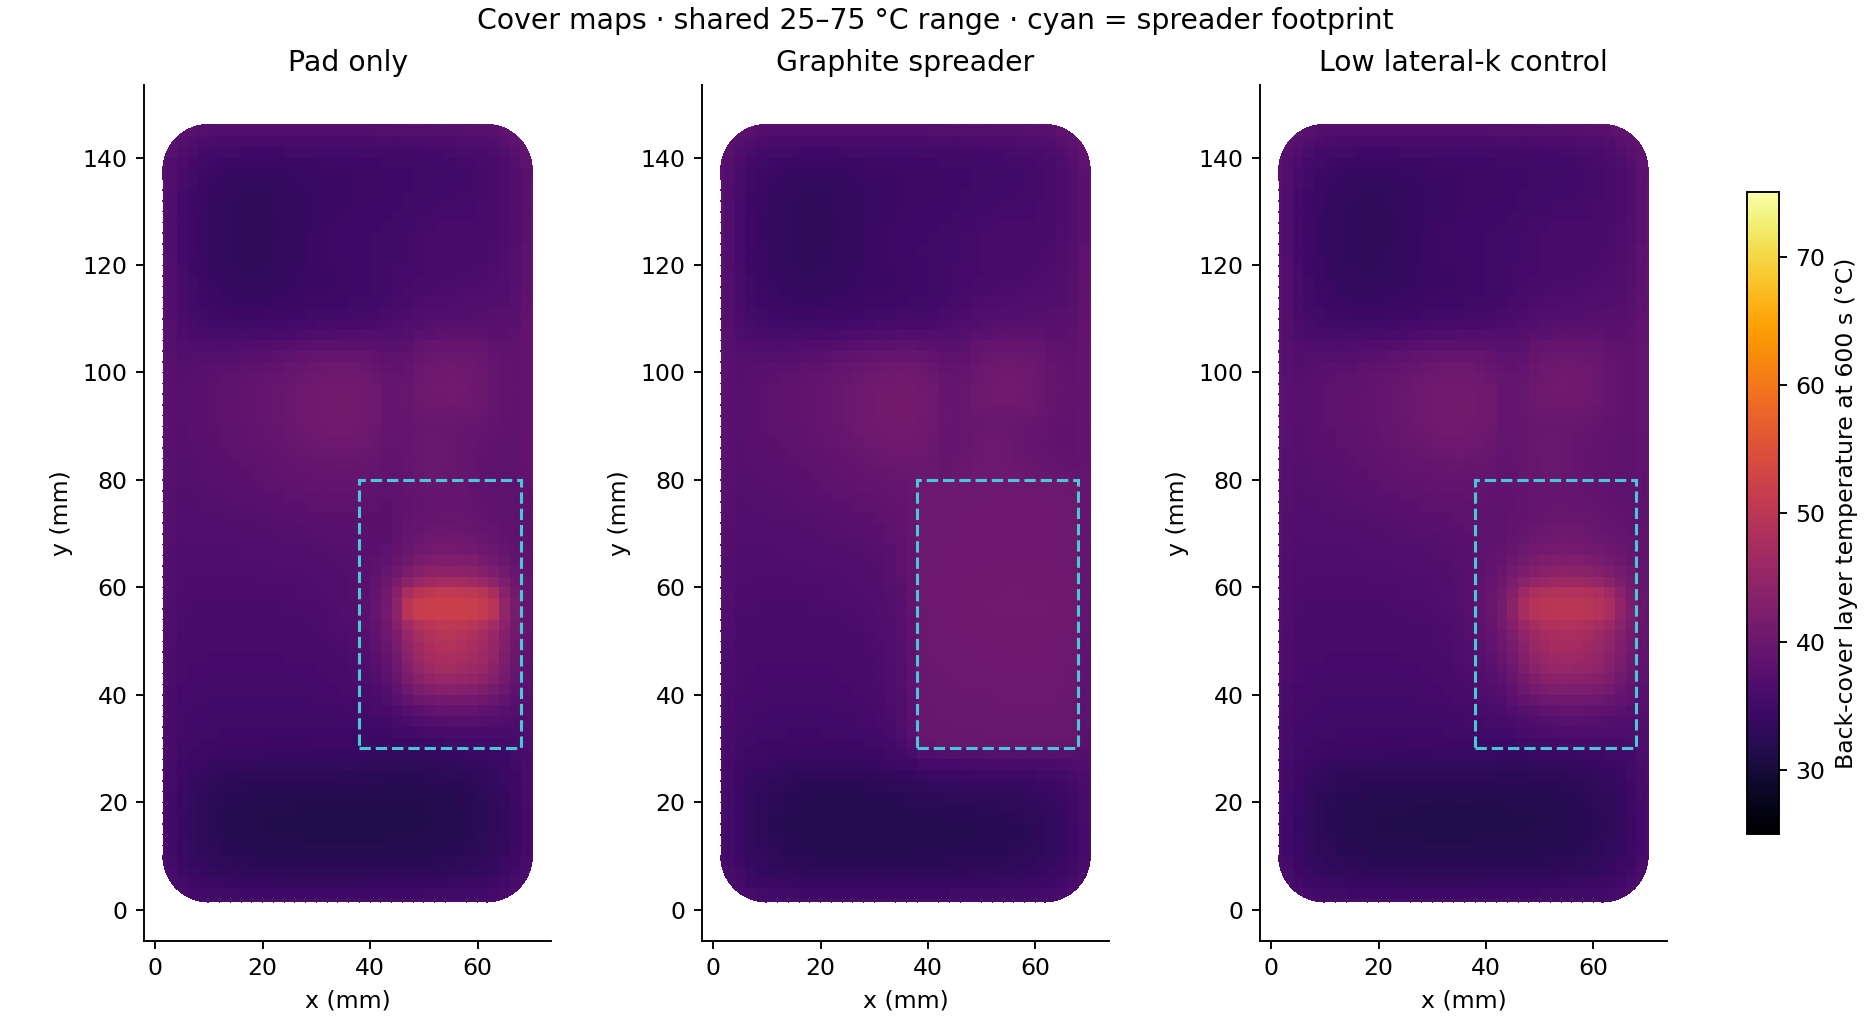
The RF board’s maximum also falls, from 61.25 to 55.02 °C. At 600 s, pad-to-graphite heat flow is 0.1760 W; the pad-only reference sends 0.0903 W directly from pad to glass. Across the full sheet footprint, adhesive-to-cover flow is 0.2914 W, which includes heat from several neighboring parts and must not be interpreted as pad heat alone.
The cell mean changes from 40.94 to 41.02 °C. The sheet couples to a small cell-edge area through its internal gap, so reducing the RF or cover peak does not guarantee that every component cools. That small modeled difference is not a demonstrated hardware margin.
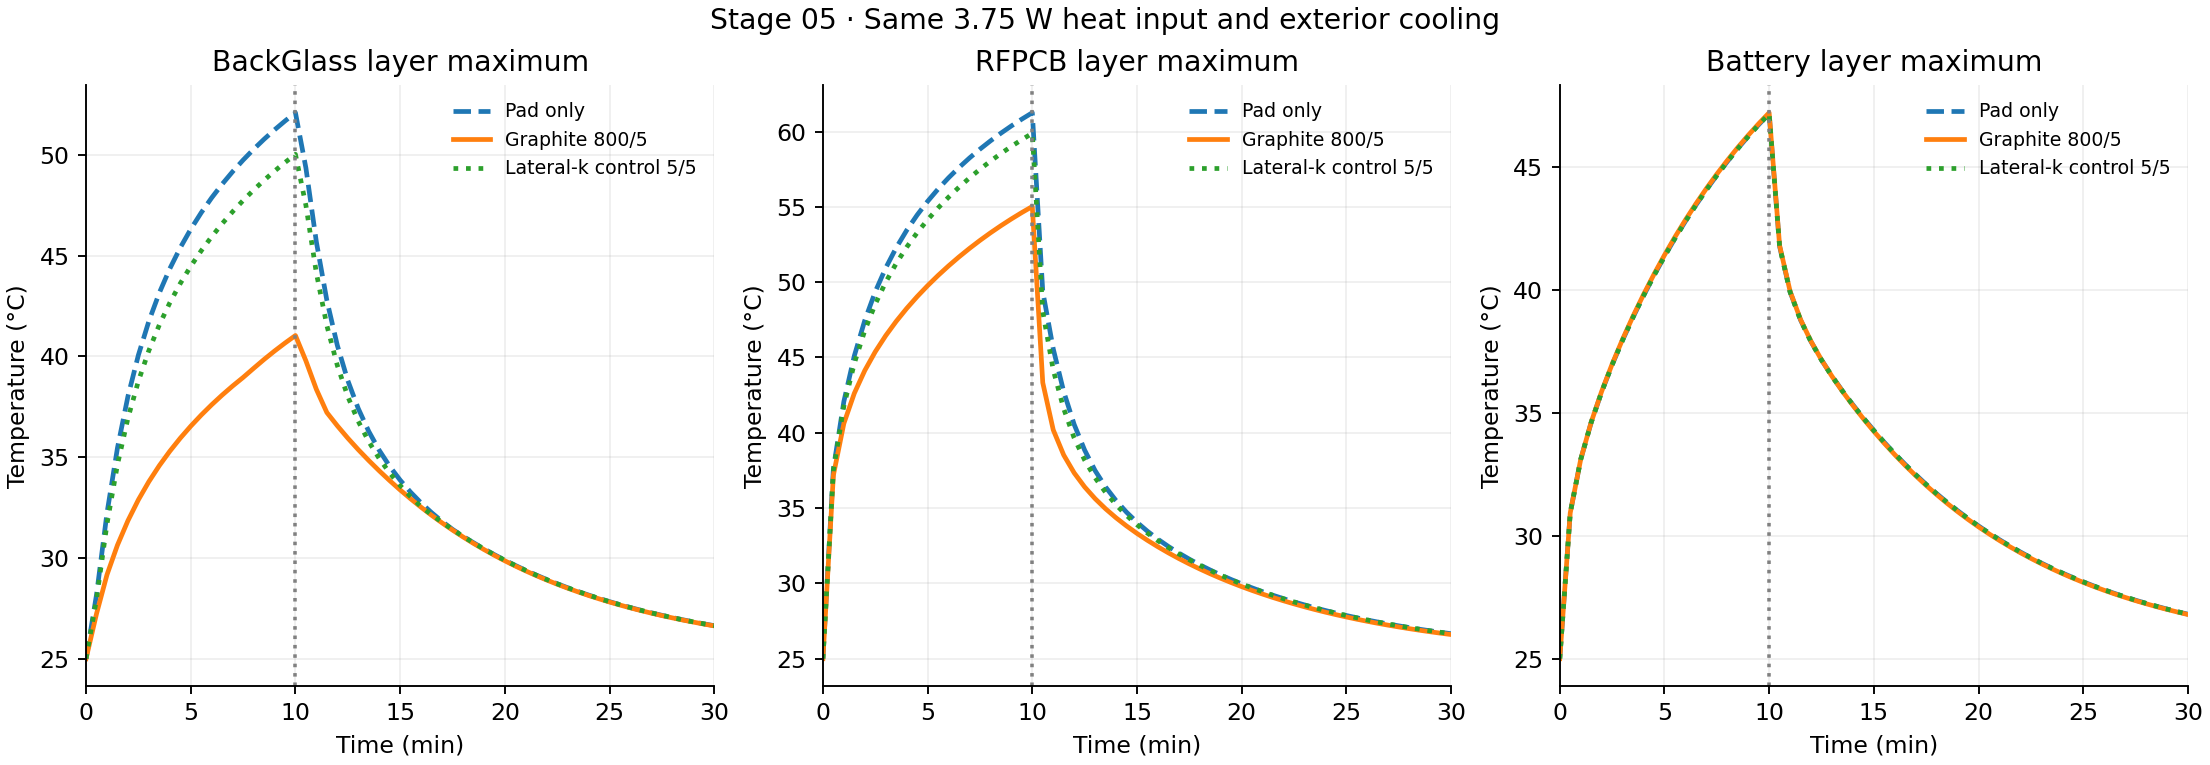
All three cases receive 2,250 J by 600 s. Exterior losses are 835.87 J for pad only, 839.96 J for graphite and 835.21 J for the control. The large peak reduction accompanies a small change in total heat rejection at this time: redistribution over the cover is the dominant effect.
6 · Verify the result and retain the limits
The pad reference has 9,710 thermal nodes; the new stack has 10,460, including 375 graphite and 375 adhesive control volumes. The finer stack has 40,236 nodes. All cases use the same conservative link equations and a 2 s implicit time step; 1 s runs test time-step sensitivity.
- Reference preservation: Stage 04 pad-only temperatures match byte for byte. Source vectors and exterior sinks are unchanged; original capacities change only in the shortened pad.
- Control isolation: the new-stack and control masses, sources, contacts and all other conductances are checked equal; only graphite’s lateral links change.
- Energy balance: largest residual across configurations is 1.00e-09 J.
- Source superposition: isolated-source rises sum to the combined rise within 1.56e-13 K before browser rounding.
- Spatial refinement: largest component-maximum difference across new-stack/control checks at 600 s is 0.4413 K.
- Time refinement: largest component-maximum difference at 600 s is 0.00793 K.
- Effect refinement: cover-maximum reduction is 11.06 K on the working grid and 11.49 K on the finer grid; the predicted effect changes by 0.44 K.
These checks assess numerical consistency, not physical accuracy. Each planar control volume has one unknown through thickness; vertical paths enter as resistances. Internal flow, nonlinear radiation, junction/skin gradients, graphite bending, compression, electrical isolation and manufacturing details remain outside the model. Material and contact measurements plus independent thermal tests are needed for physical validation.
Reproduce and inspect the spreader study
The thermal solve uses free Python, NumPy, SciPy, Shapely and Matplotlib. FreeCAD opens the native geometry; ParaView opens each saved case. The source archive includes the frozen pad reference, all three configurations, conductance networks, time histories and fields.
Solver reference: SciPy sparse factorization. This study remains an independent assumed concept, without measured product parameters.