 Khani Solutions
Independent open-source thermal study · Stage 07
What changes when the adhesive gets thicker?
Keep the largest 50 × 70 mm graphite sheet and compare 25, 50 and 100 µm adhesive. Follow the cover hot spot, battery average and peak, and the consequences of fitting the stack inside the same enclosure.
Independent teaching geometry, properties, contacts and loads. Numerically verified models, without experimental validation or product qualification. No Apple or Wisk product performance is claimed.
Inspect component maps ↓ · Follow the explanation ↓ · Download source, CAD and VTK ↓
Compare the cover maps and follow the heat
Select adhesive thickness, component and time. The paired gallery shows the 25 µm Stage 06 largest-sheet reference on the left and the selected adhesive on the right. Each field uses its matching pad, graphite and adhesive geometry. The resistance-only diagnostic below is a separate numerical check, not another physical stack in this viewer.
Loading three solved adhesive stacks…
Drag to rotate · Scroll to zoom · Saved finite-volume temperature fields
Paired 25 µm / selected-adhesive maps for every component
All component temperatures at the selected time
| Component | 25 µm max (°C) | Selected adhesive max (°C) | Change in max (K) | Mean reference → selected (°C) |
|---|
Negative change means cooling. Maxima can occur at different locations. Mean values are capacity weighted within each component. A package has one effective temperature, not a semiconductor junction prediction. Layer values are displayed on CAD surfaces but do not resolve through-thickness or exterior skin gradients.
Why the temperatures change, step by step
1 · Preserve the largest-sheet reference
The graphite stays at x = 18–68 mm, y = 30–100 mm, with 0.10 mm thickness, kxy = 800 and kz = 5 W/(m·K). The 25 µm case reproduces the entire Stage 06 largest-sheet field byte for byte. Initial and ambient temperature remain 25 °C. Battery heat is 2 W and package heat totals 1.75 W for 600 s, followed by 1,200 s with sources off. Exterior loss remains 8 W/(m²·K) on display, cover and frame only.
2 · Fit three bondlines inside the fixed enclosure
The inner back cover stays at z = 7 mm. Adhesive grows inward, moving the graphite inward and shortening the installed RF pad from 2.075 to 2.050 to 2.000 mm. Pad contact stays 80 mm²; each bonded sheet interface stays 3,500 mm². The graphite-to-cell gap falls from 0.675 to 0.650 to 0.600 mm. The sheet remains separated from the cell; projected coupling is not physical contact.
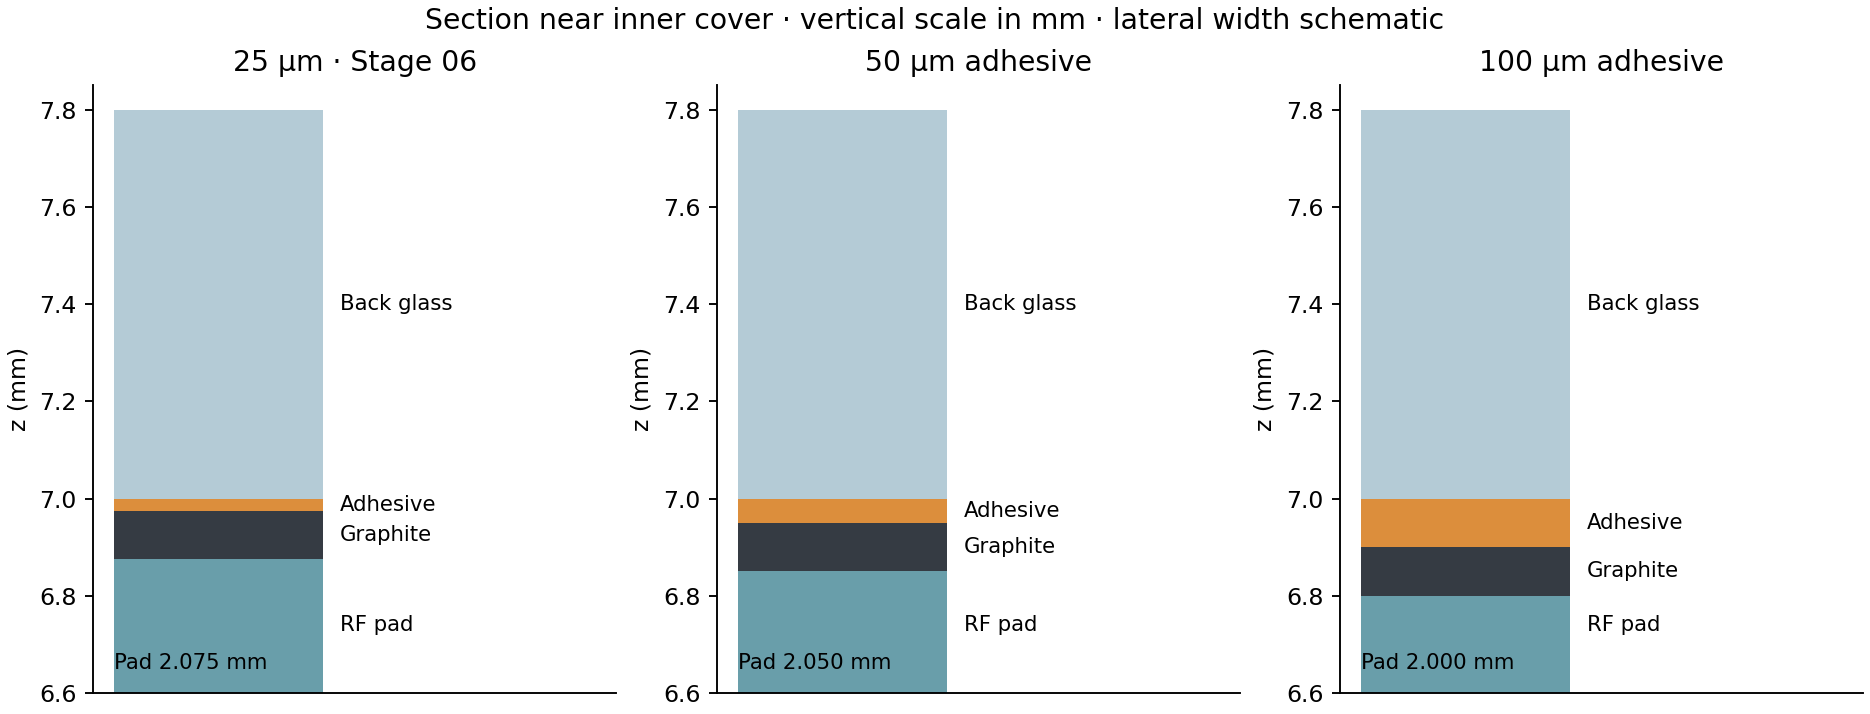
Adhesive conductivity stays 0.2 W/(m·K), density 1,200 kg/m³ and specific heat 1,500 J/(kg·K). Each bonded contact retains R″ = 0.0001 m²·K/W. Pad and graphite properties remain unchanged. Thickness also changes the adhesive and pad lateral conductances. Adhesive sheet conductance rises from 0.000005 to 0.000020 W/K per square, still much smaller than graphite’s 0.08 W/K per square. This is a fitted-stack thickness study: it changes adhesive mass and vertical position as well as adhesive resistance. No compression or manufacturing tolerance is modeled.
R″adhesive = t/k · C = ρcpAt · R″bond = t/k + 2R″contact
| Adhesive | Graphite bottom z (mm) | Bulk R″ (m²·K/W) | Bond + contacts R″ (m²·K/W) | Adhesive mass (g) | Assembly capacity (J/K) |
|---|---|---|---|---|---|
| 25 µm · Stage 06 | 6.875 | 0.000125 | 0.000325 | 0.105 | 97.0908 |
| 50 µm adhesive | 6.850 | 0.000250 | 0.000450 | 0.210 | 97.2439 |
| 100 µm adhesive | 6.800 | 0.000500 | 0.000700 | 0.420 | 97.5501 |
The displayed bond resistance excludes graphite and cover half-layer terms. The actual graphite-center to cover-center path includes those terms: 0.000735 m²·K/W at 25 µm and 0.001110 at 100 µm. Bulk adhesive resistance increases fourfold, while the full center-to-center path rises by about 51% because the contact and half-layer terms remain. The larger adhesive resistance does not act alone: the adhesive gains 0.4725 J/K of capacity, while the shorter pad loses 0.0132 J/K; net assembly capacity rises by 0.4593 J/K.
3 · Read the temperatures at the same time
| At 600 s | Pad (mm) | Cover max (°C) | Cover mean (°C) | Cell mean (°C) | Cell max (°C) | RF max (°C) |
|---|---|---|---|---|---|---|
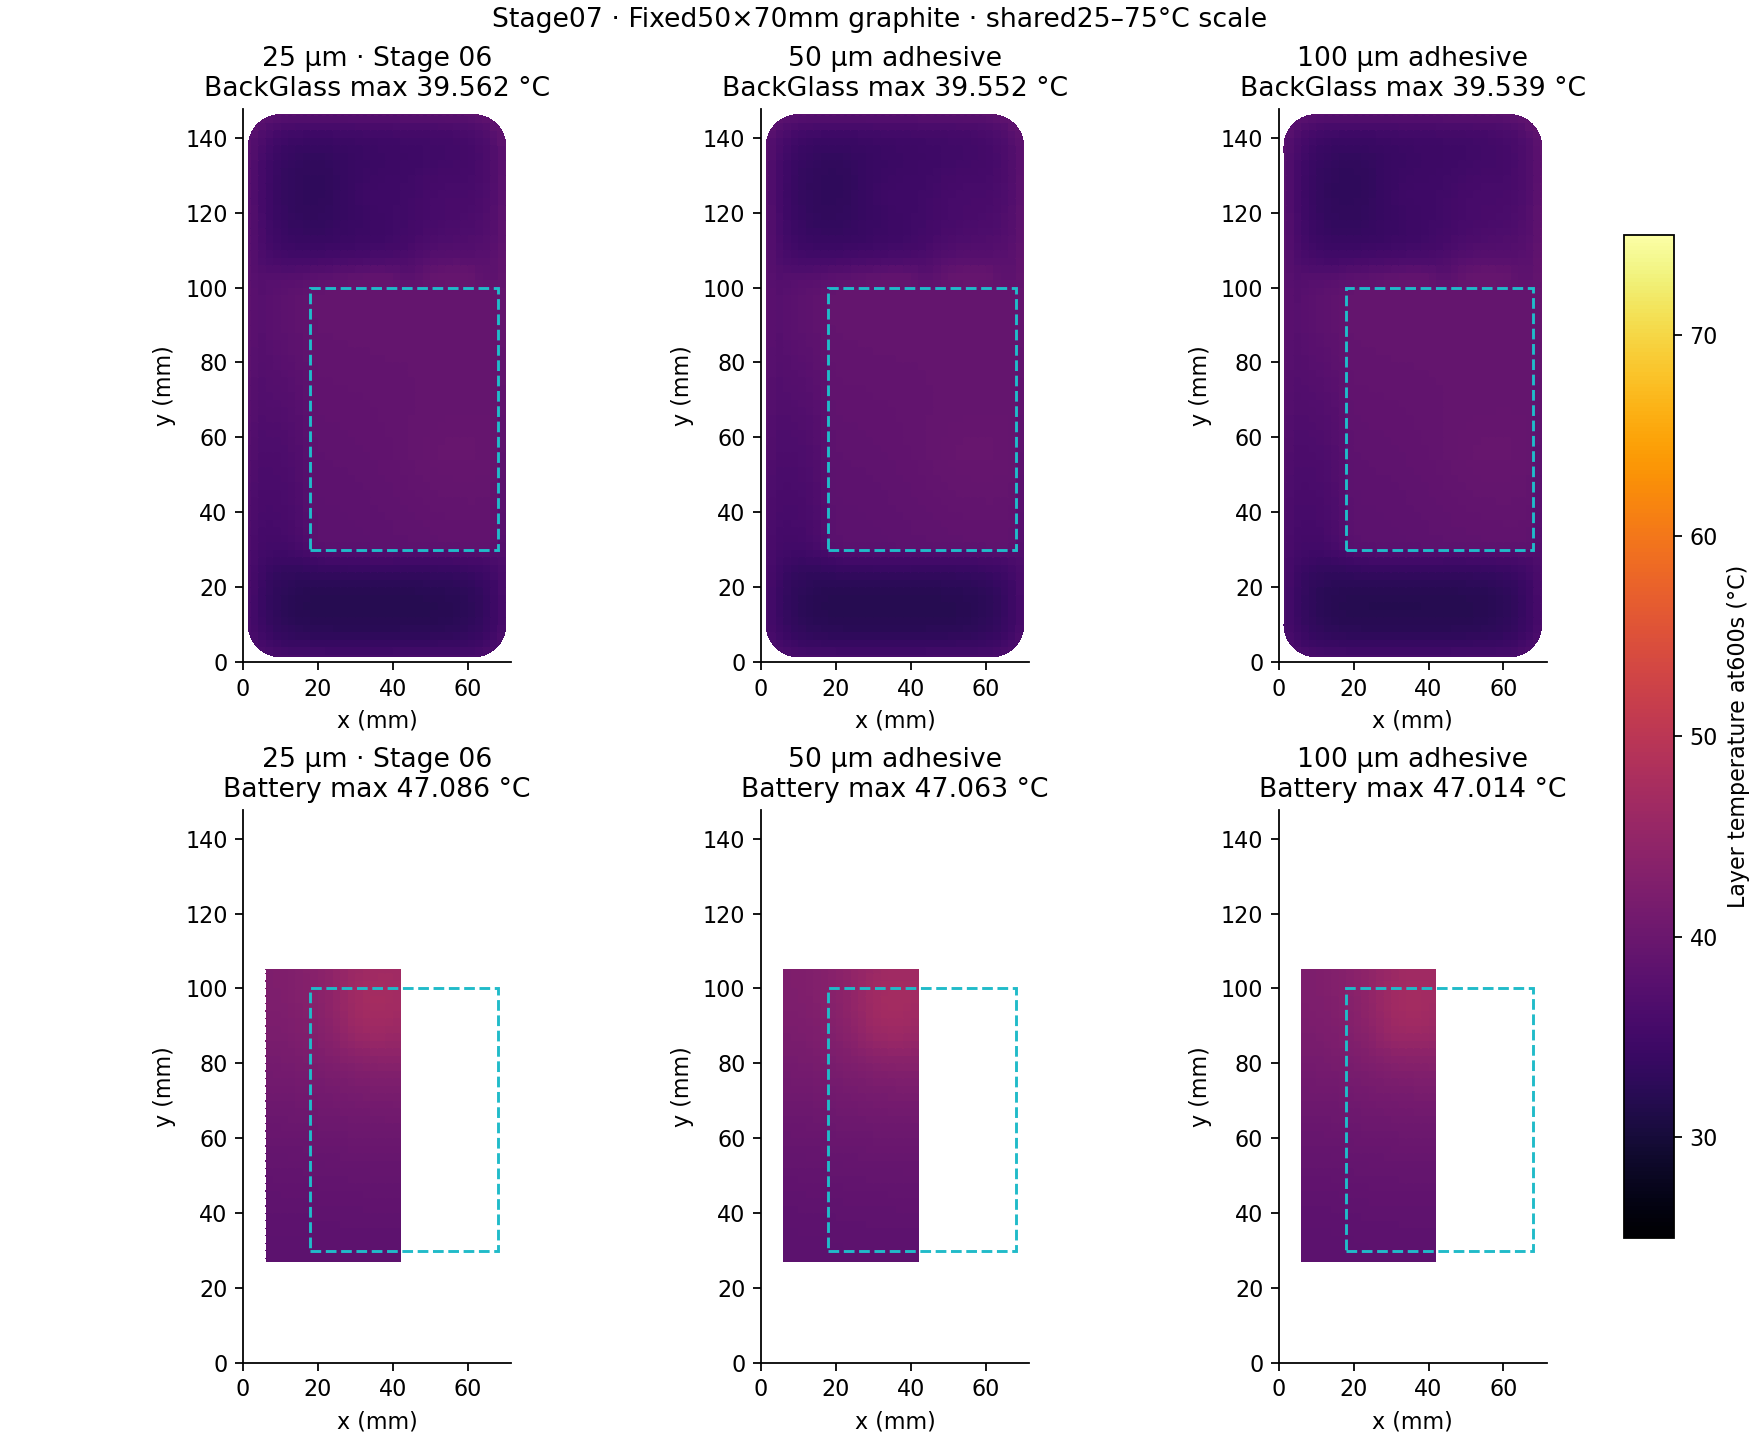
| 25 µm · Stage 06 | 2.075 | 39.5617 | 36.6416 | 41.0711 | 47.0858 | 54.1647 |
| 50 µm adhesive | 2.050 | 39.5523 | 36.6369 | 41.0550 | 47.0627 | 54.1205 |
| 100 µm adhesive | 2.000 | 39.5386 | 36.6283 | 41.0218 | 47.0143 | 54.0296 |
Changing from 25 to 100 µm gives -0.02308 K in the cover maximum, -0.04931 K in the battery average and -0.07143 K in the battery maximum. Extra digits expose small model sensitivities; they do not imply measured accuracy. Maxima may move, so differences between maxima need not equal a change at one fixed point.
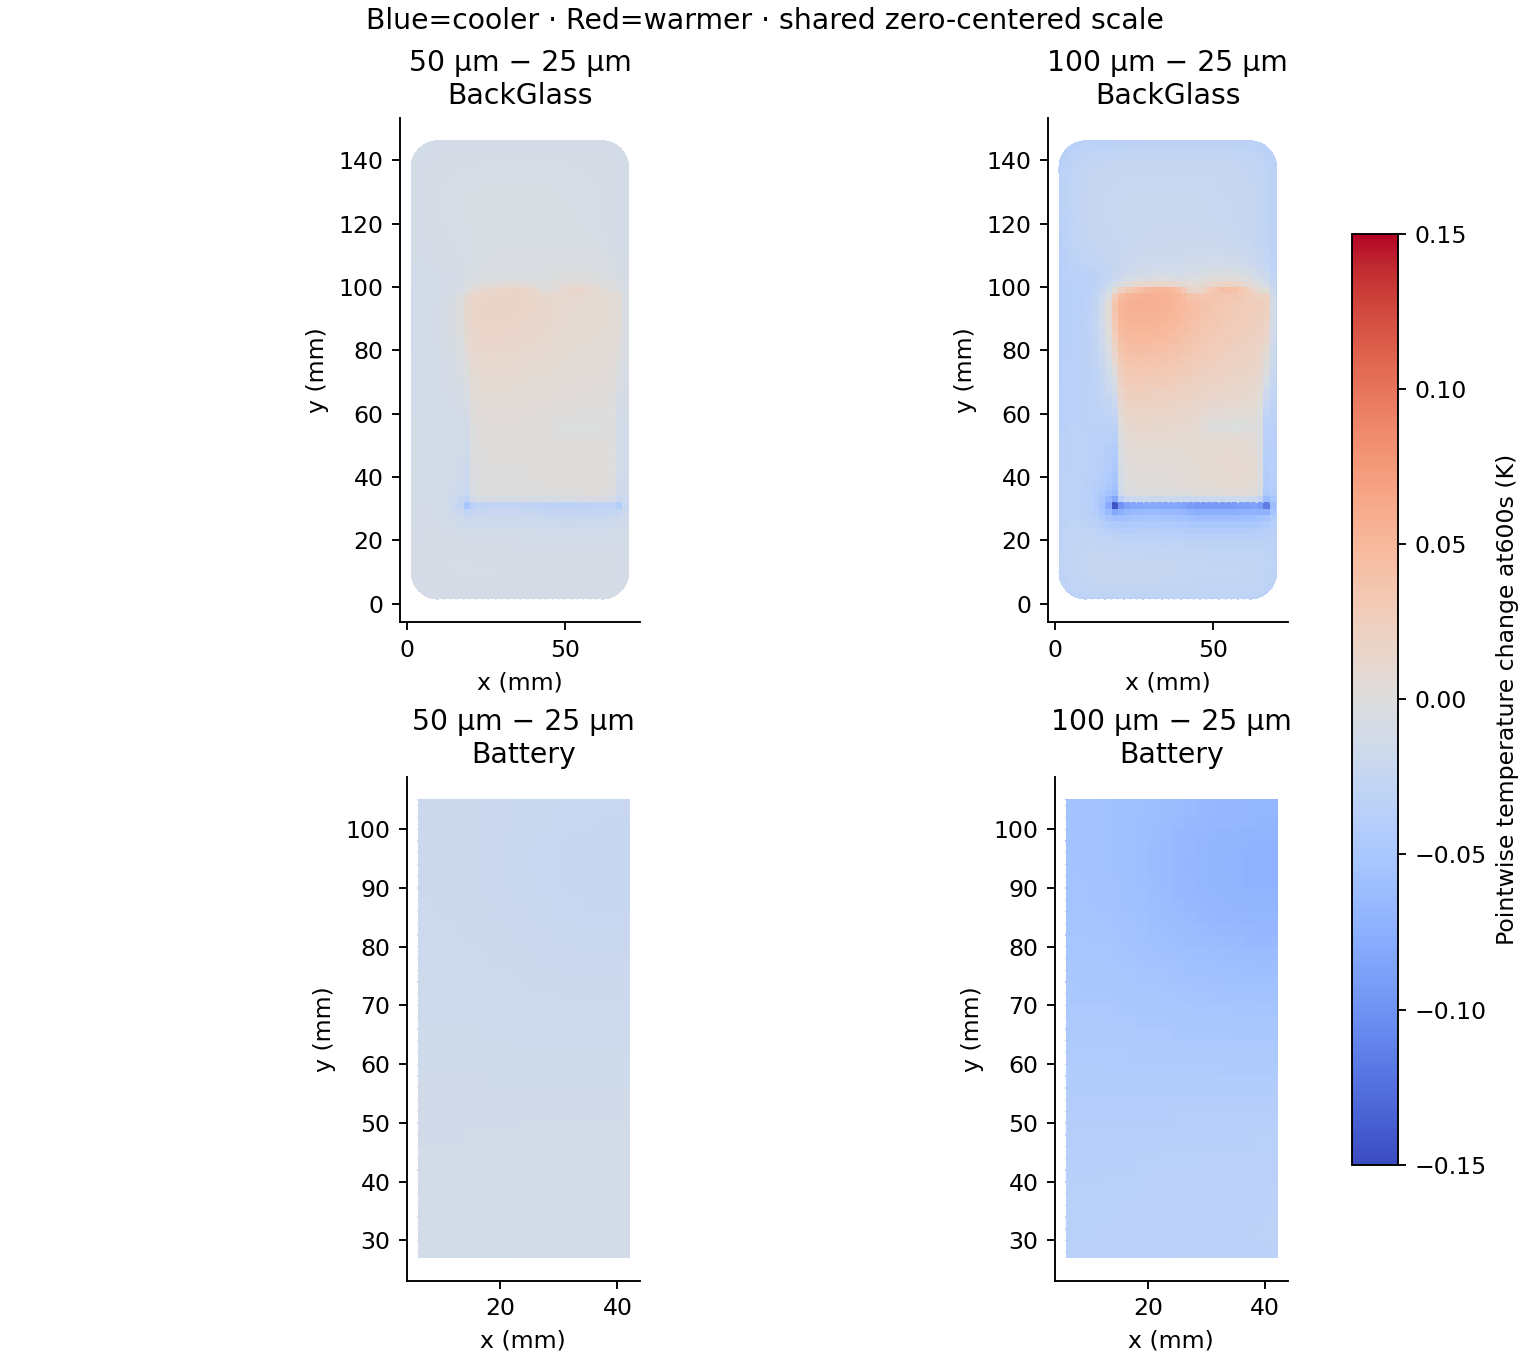
Difference maps compare matching planar control volumes. Blue means cooler and red means warmer. Their shared zero-centered scale differs from the absolute-temperature scale. Some local cover regions warm even when the cover mean and global maximum fall. Thermal layer values are uniform through thickness; these are not resolved exterior skin temperatures.
4 · Isolate adhesive resistance from the fitted-stack changes
A separate diagnostic retains the 25 µm geometry, mass, pad, gaps, heat sources and all lateral conductances. It changes only the two adhesive half-thickness terms in the graphite-to-adhesive and adhesive-to-cover vertical resistances to the 100 µm equivalent. No extra material is installed in this numerical diagnostic. It is not another physical CAD design.
| At 600 s (°C) | 25 µm reference | 100 µm resistance only | 100 µm fitted stack |
|---|---|---|---|
| Cover maximum | 39.56166 | 39.56164 | 39.53858 |
| Cover average | 36.64156 | 36.63144 | 36.62832 |
| Battery average | 41.07109 | 41.07698 | 41.02178 |
| Battery maximum | 47.08575 | 47.09204 | 47.01433 |
| Graphite average | 39.02864 | 39.06522 | 39.10036 |
This comparison distinguishes the response to extra vertical resistance from the combined effects of added adhesive storage, shorter pad and smaller internal gaps. Resistance-only and fitted-stack results should not be treated as interchangeable. Their difference also includes coupling between those changes; it is not a separate measurement of heat-capacity effects.
In this run, resistance alone changes the battery average by +0.005886 K and its peak by +0.006288 K. The fitted 100 µm stack instead lowers both at 600 s. Thus the geometry and storage changes collectively reverse the resistance-only battery trend. A shorter cell-to-sheet gap strengthens coupling, while the added adhesive capacity changes the transient energy storage. Their individual contributions have not been isolated in this stage.
The graphite average rises from 39.02864 to 39.10036 °C even as the cover mean and cell average cool slightly. The cover maximum is near the frame edge outside the sheet, so a larger local bond resistance need not increase the global cover peak.
5 · Follow energy through the cell and cover
| At 600 s | Cell → sheet (W) | Pad → sheet (W) | Adhesive → cover (W) | Stored (J) | Exterior loss (J) |
|---|---|---|---|---|---|
| 25 µm · Stage 06 | +0.155745 | 0.182144 | 0.527811 | 1413.1243 | 836.8757 |
| 50 µm adhesive | +0.157899 | 0.181560 | 0.528322 | 1414.0484 | 835.9516 |
| 100 µm adhesive | +0.162483 | 0.180322 | 0.529549 | 1415.8699 | 834.1301 |
All physical cases receive 2,250 J by 600 s. Stored energy and exterior loss close that balance. Instantaneous adhesive-to-cover flow includes several sources, not just RF heat. Positive cell-to-sheet flow means net heat leaves the cell at that instant; it does not by itself establish the battery’s integrated cooling.
| Integrated 0–600 s | Cell → midplate (J) | Cell → uncovered cover (J) | Cell → graphite (J) | Stored in cell (J) |
|---|---|---|---|---|
| 25 µm · Stage 06 | 601.79580 | 56.57674 | 59.66440 | 481.96307 |
| 50 µm adhesive | 601.03096 | 56.58980 | 60.89990 | 481.47934 |
| 100 µm adhesive | 599.40581 | 56.58509 | 63.52487 | 480.48423 |
The cell receives 1,200 J. Its three outward heat paths plus stored energy sum to that input. Relative to 25 µm, the 100 µm fitted stack changes cell storage by -1.478843 J. Dividing by the unchanged cell capacity, 29.98944 J/K, gives -0.049312 K, matching the battery-average change. This audit uses the exported conductance networks and solver-consistent end-step integration.
For the 100 µm fitted stack, the graphite path removes 3.86047 J more from the battery than the reference. The midplate path removes 2.38998 J less and the uncovered-cover path removes 0.00835 J more. Together they remove an additional 1.47884 J, explaining the lower cell average at 600 s. This is a path balance for the full fitted design, not an attribution of each geometry or capacity change in isolation.
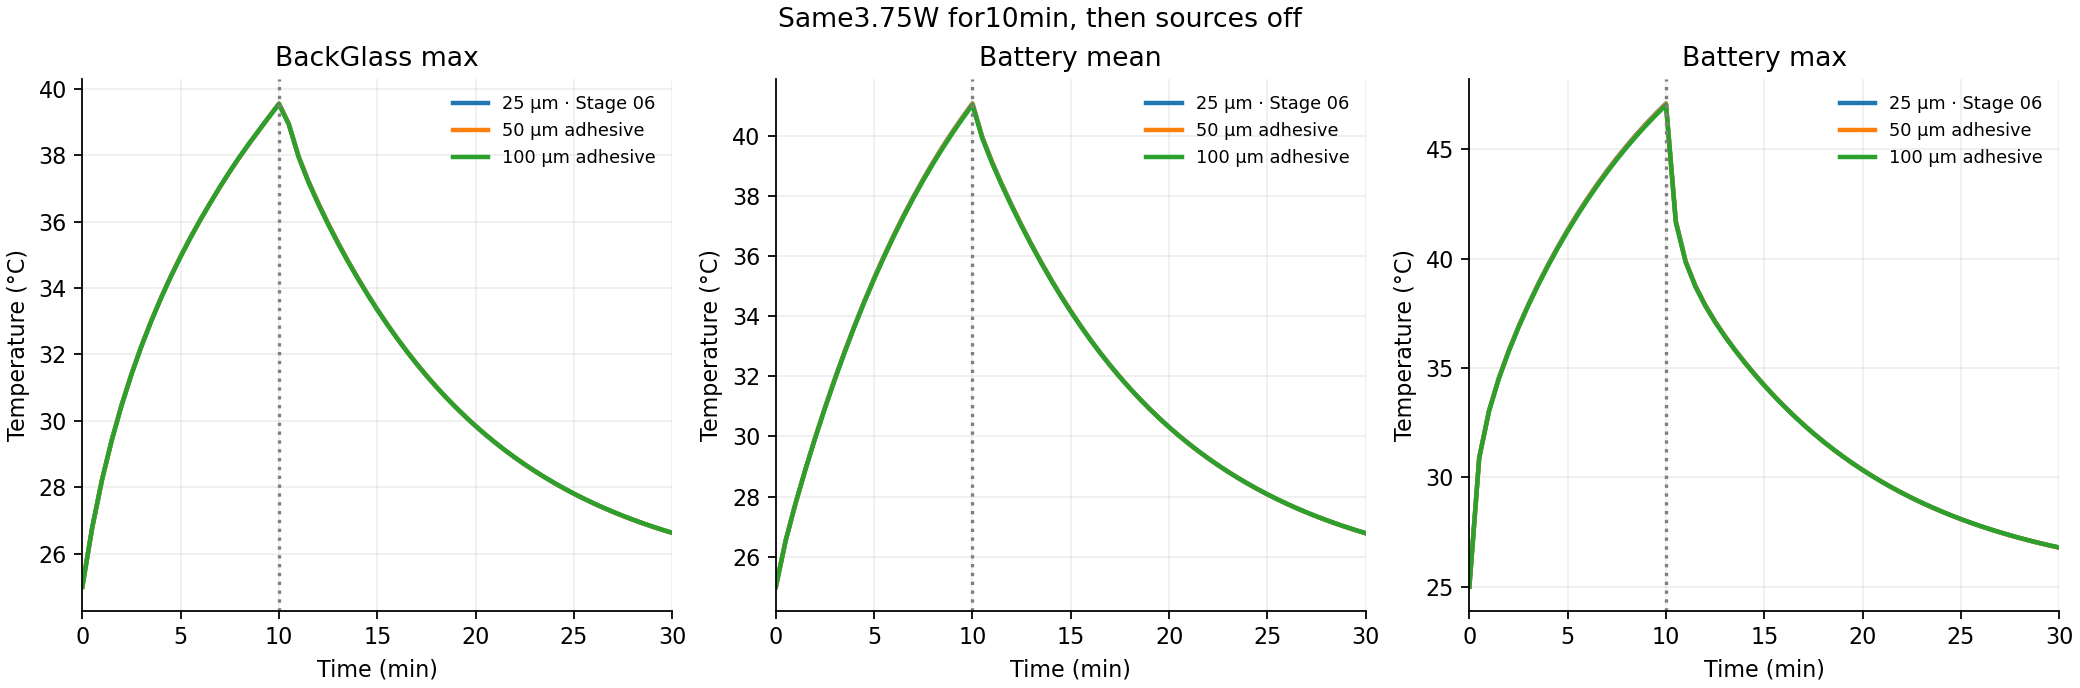
At 1,800 s, the battery average is 26.77642 °C for 25 µm and 26.78224 °C for 100 µm: the thicker fitted stack is now slightly warmer. These are transient comparisons, not steady-state results. Added thermal capacity can delay warming during the pulse and alter cooling afterward. The diagnostic tests added resistance separately; the full stack response includes resistance, storage and geometry effects.
6 · Check that the changes survive numerical refinement
Every physical case has 11,460 thermal nodes, including seven lumped packages; the 1 mm mesh has 44,236 nodes. Working time step is 2 s, checked at 1 s. Across physical cases, the largest component-maximum mesh difference at 600 s is 0.19737 K and time-step difference is 0.00790 K. The largest full-transient energy residual is 7.98e-10 J. Source superposition is also checked. The resistance-only diagnostic receives its own mesh/time and energy checks.
| Effect at 600 s | 2 mm change (K) | 1 mm change (K) | Effect sensitivity (K) |
|---|---|---|---|
| medium − 25 µm · BackGlass_max | -0.00934 | -0.00938 | 0.00005 |
| medium − 25 µm · Battery_mean | -0.01613 | -0.01618 | 0.00005 |
| medium − 25 µm · Battery_max | -0.02304 | -0.02286 | 0.00018 |
| thick − 25 µm · BackGlass_max | -0.02308 | -0.02859 | 0.00551 |
| thick − 25 µm · Battery_mean | -0.04931 | -0.04946 | 0.00015 |
| thick − 25 µm · Battery_max | -0.07143 | -0.07090 | 0.00053 |
For small changes, inspect these paired effects rather than inferring precision from decimal places. Native CAD checks confirm 67 valid non-overlapping solids, full bonded contacts and matching STEP volumes; saved native files are reopened. Exported networks independently reproduce every saved temperature, and VTK mappings are checked.
Limits: assumed properties and contacts, fixed linearized internal radiation, resistance-based air gaps without CFD flow, one temperature per layer cell through thickness, lumped packages, no electrochemistry, compression, nonlinear radiation or measured thermal validation. Gray CAD accessories and optional cooling-path candidates do not automatically add heat paths; only the named solved components and stated links participate. This stage is not a hardware adhesive recommendation or a battery safety margin.
Reproduce and inspect the adhesive comparison
Free Python, NumPy, SciPy, Shapely and Matplotlib solve the model; FreeCAD opens the native geometry and ParaView reads the VTK. Run source/run_adhesive_study.py, then source/verify_exports.py. Read the README for the inherited input conventions.